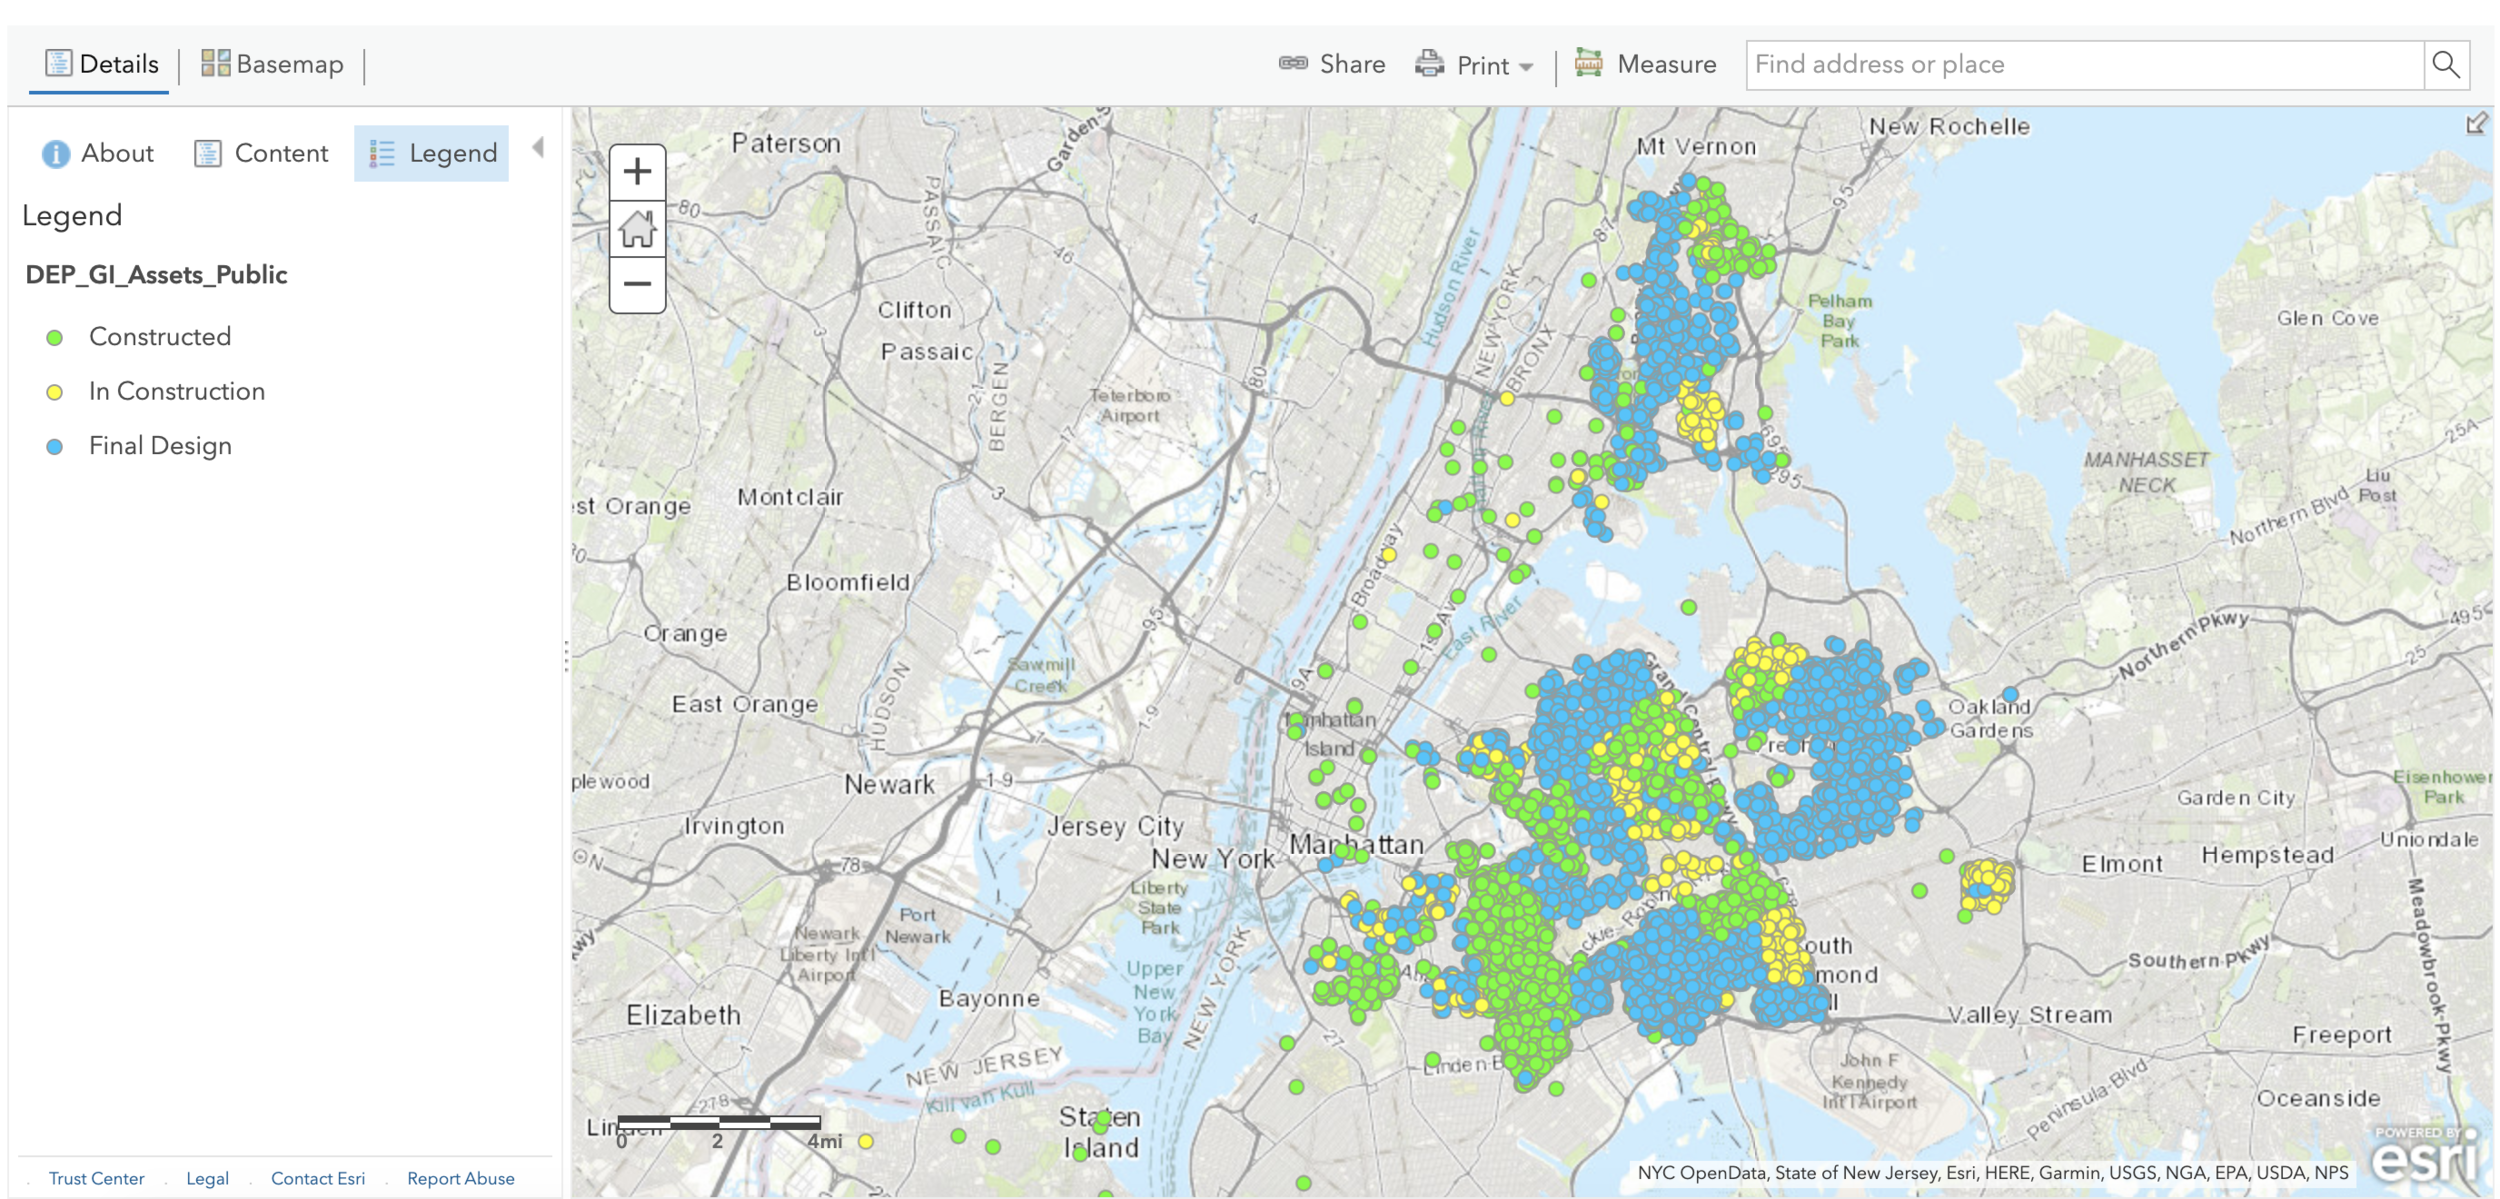
Final Project Presentation

Algorithmic Bus Stops

Description:

For my final project I designed workshop in reaction to companies using generative design to design their offices and the increasingly ubiquitous smart city technologies that incorporate algorithms into the materiality of the spaces we inhabit and navigate every day using the bus stop as a focus of study in order to critically engage with and discuss the implications of these new technologies.

Below are video demos of the AR component and photos of the workshop booklet:

Environment:

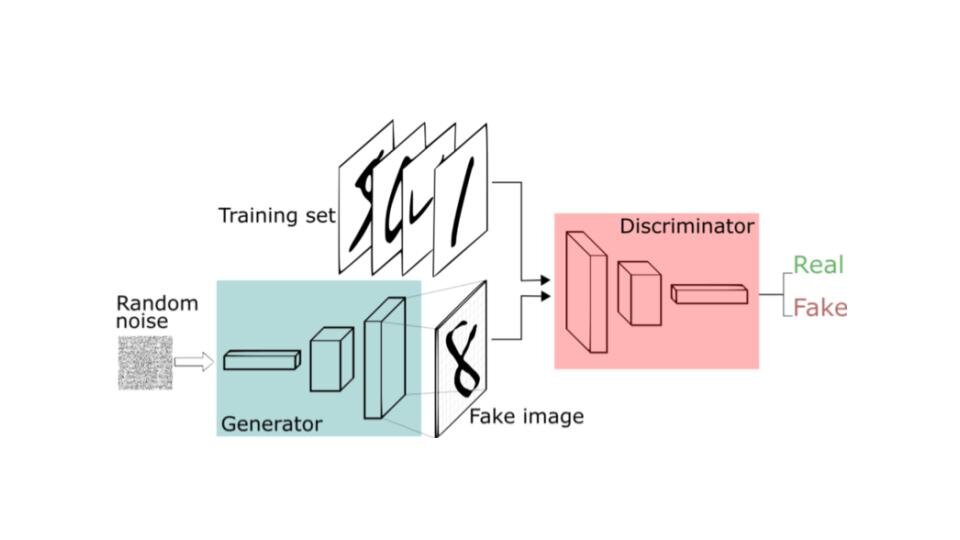
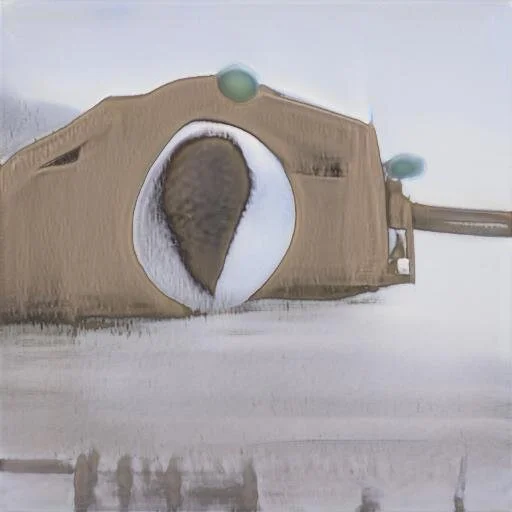
This project is building on my collections project in which I generated images of imagined bus stops using a styeGAN model in Runway. The process of training the model in Runway works by using transfer learning to train a model on top of existing ones. Within the interface, there are limited options: faces, cupcakes, flower, skyscrapers. I had previously used the bedroom model because I felt that the architecture was most similar to the bus stop photos. For this version of the project, I decided to push the design of these bus stops further into the Post Natural by training my models on top of the flower and forest models in addition. I also think that this sets up an interesting question for the workshop: the output all uses the same dataset, but the outcome looks so different - can we work together to identify exactly why? Where are we getting our design inspiration from and what materials are we using?

Screenshot 2019-12-08 14.17.35.png
 
Screenshot 2019-12-08 14.20.18.png

Artists and themes:

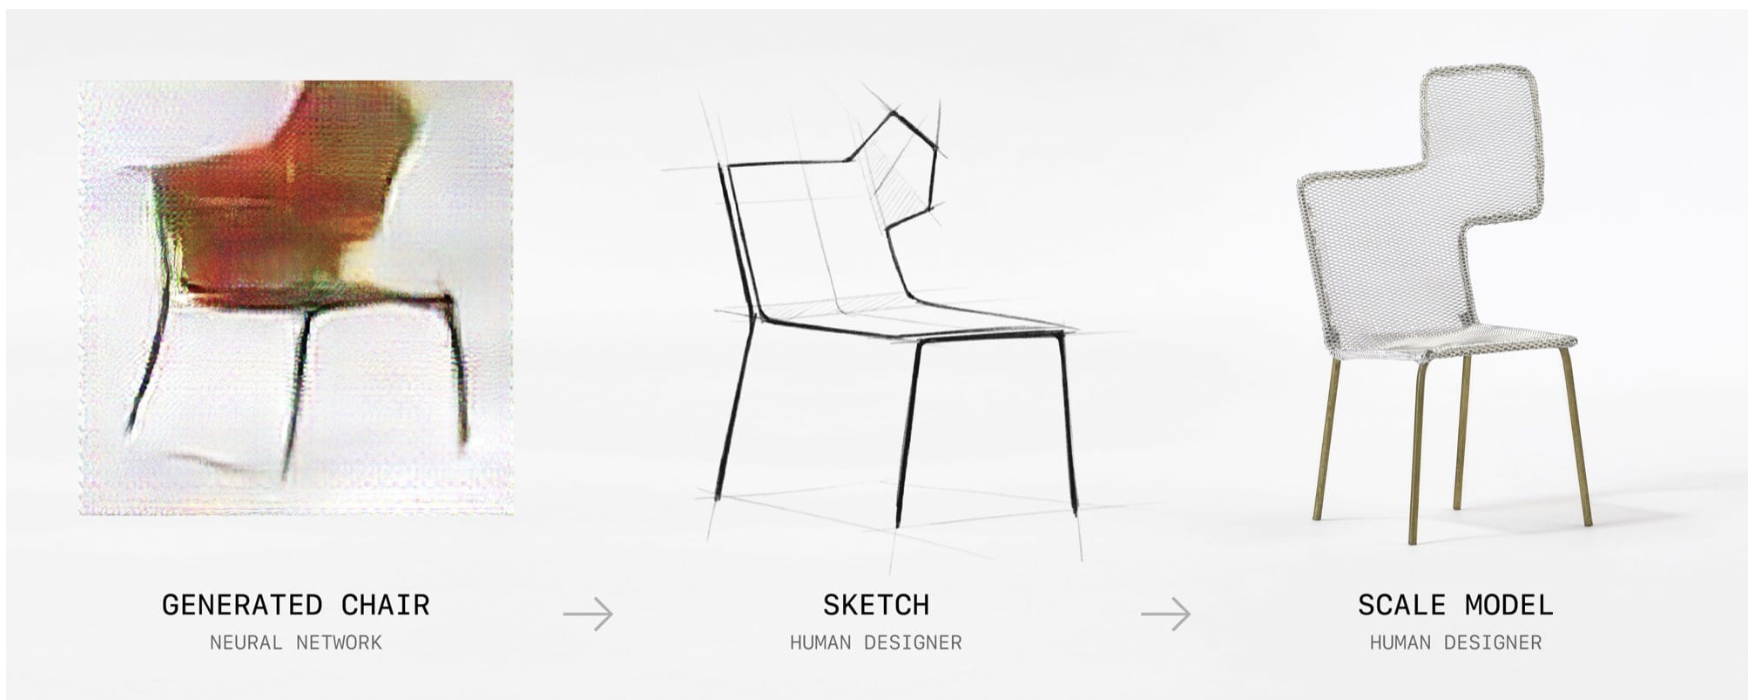
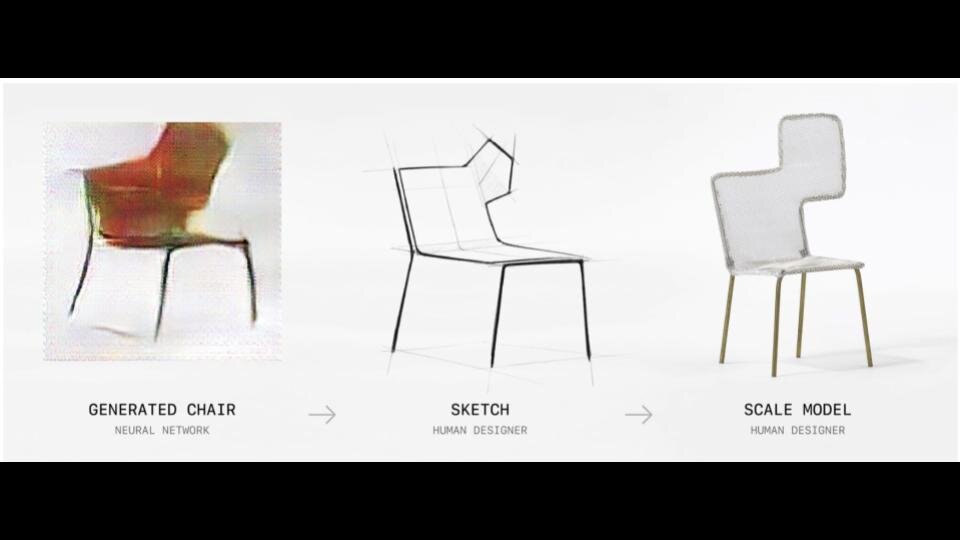
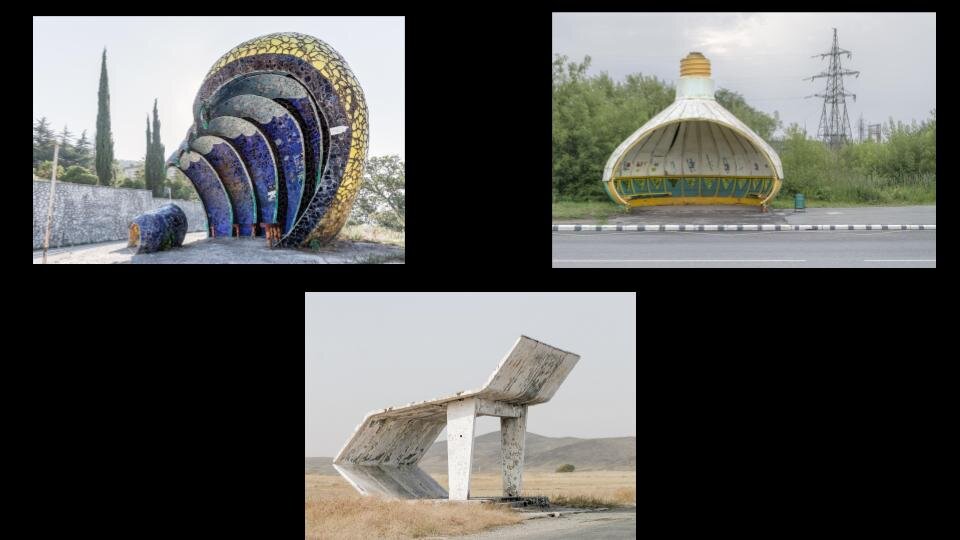
The methods I used in this project were inspired by The Chair Project by Philipp Schmitt. In terms of forms, I was inspired by the work of Veto Acconci (photos above), especially his designs of playgrounds and public spaces.

The goal of this project is to think together about questions of agency, ownership and groups that benefit in design processes. This and I hope to bring these questions out into the open with the AR element that brings these bus stops out from the digital screen into the physical world - participants can get close to them to inspect them, view them from different angles and step back to view it from a zoomed out perspective.

Technology/Site/Audience

The technologies I am using in the piece are the following:

  1. First, I used a Chrome extension to download bus stop images from Google Images

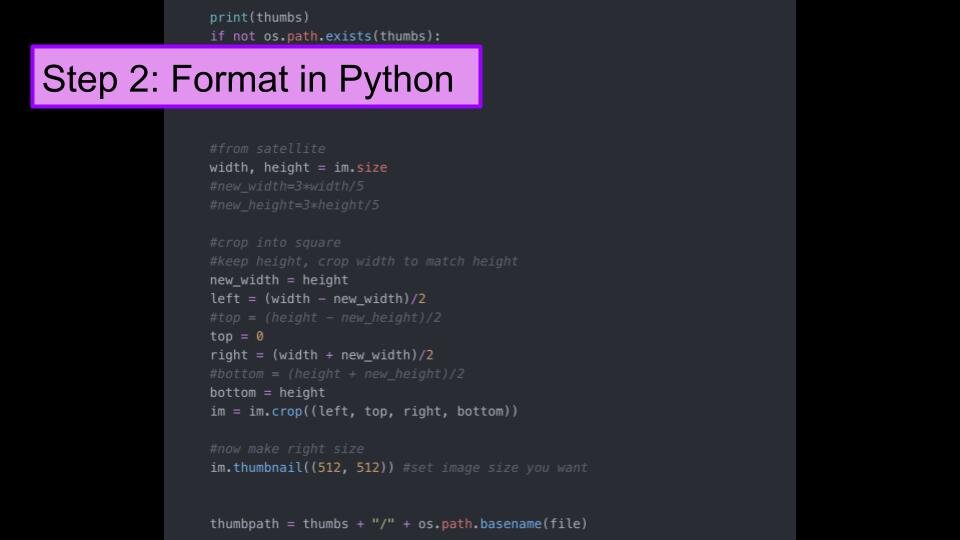
  2. Next, I used python to format the images [link]

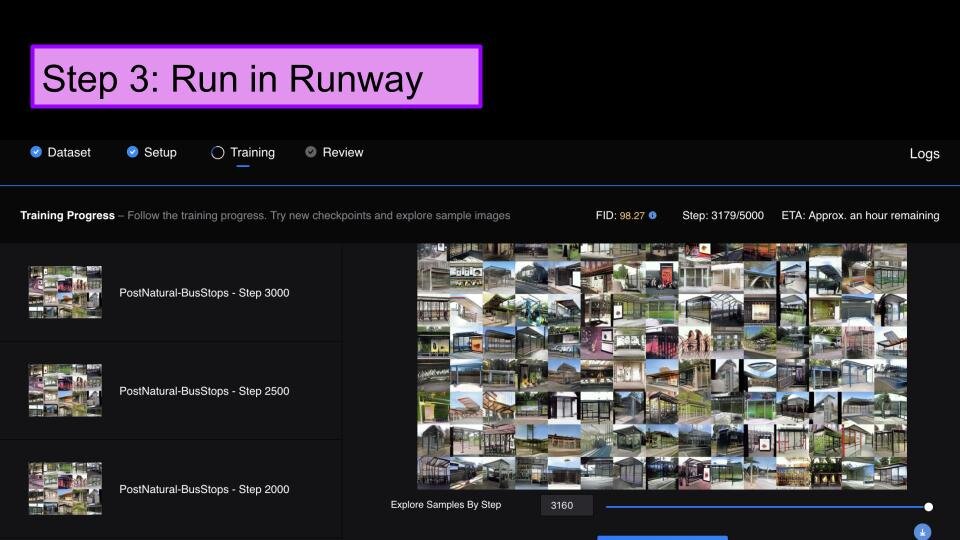
  3. Then I used RunwayML to train new models based on existing styleGAN models of bedrooms, flowers and forests [link]

  4. I then scanned the output and downloaded my favorite images. From there I chose one from each of the three models I had trained.

  5. I used Oculus Medium to re-imagine these images as a 3D model.

  6. Finally, I used SparkAR to make a prototype AR app to view the 3D models on top of a metrocard (I initially tried Unity but ran into some technical problems with Vuforia)


The output is not site specific, although I would like to make it more so - in fact, the bus stop images are from all over the world and I .

The audience has no agency in the form of the work that was designed. and the interaction is in investigating the output and process by writing in a booklet I designed for the workshop. The goal of this is to recognize that this doesn’t happen effectively in public design space currently and a step towards thinking about new tools (some of which are used in this project) that could do this. Instead, through the activity and discussion prompts, the workshop attendees are encouraged to critically think about and discuss the technologies behind the design process.

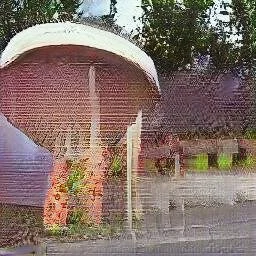
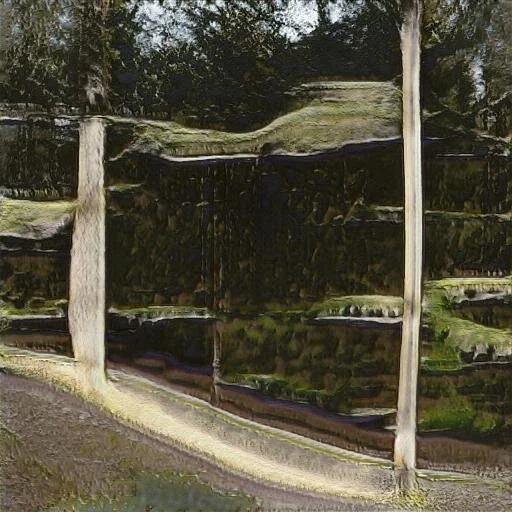
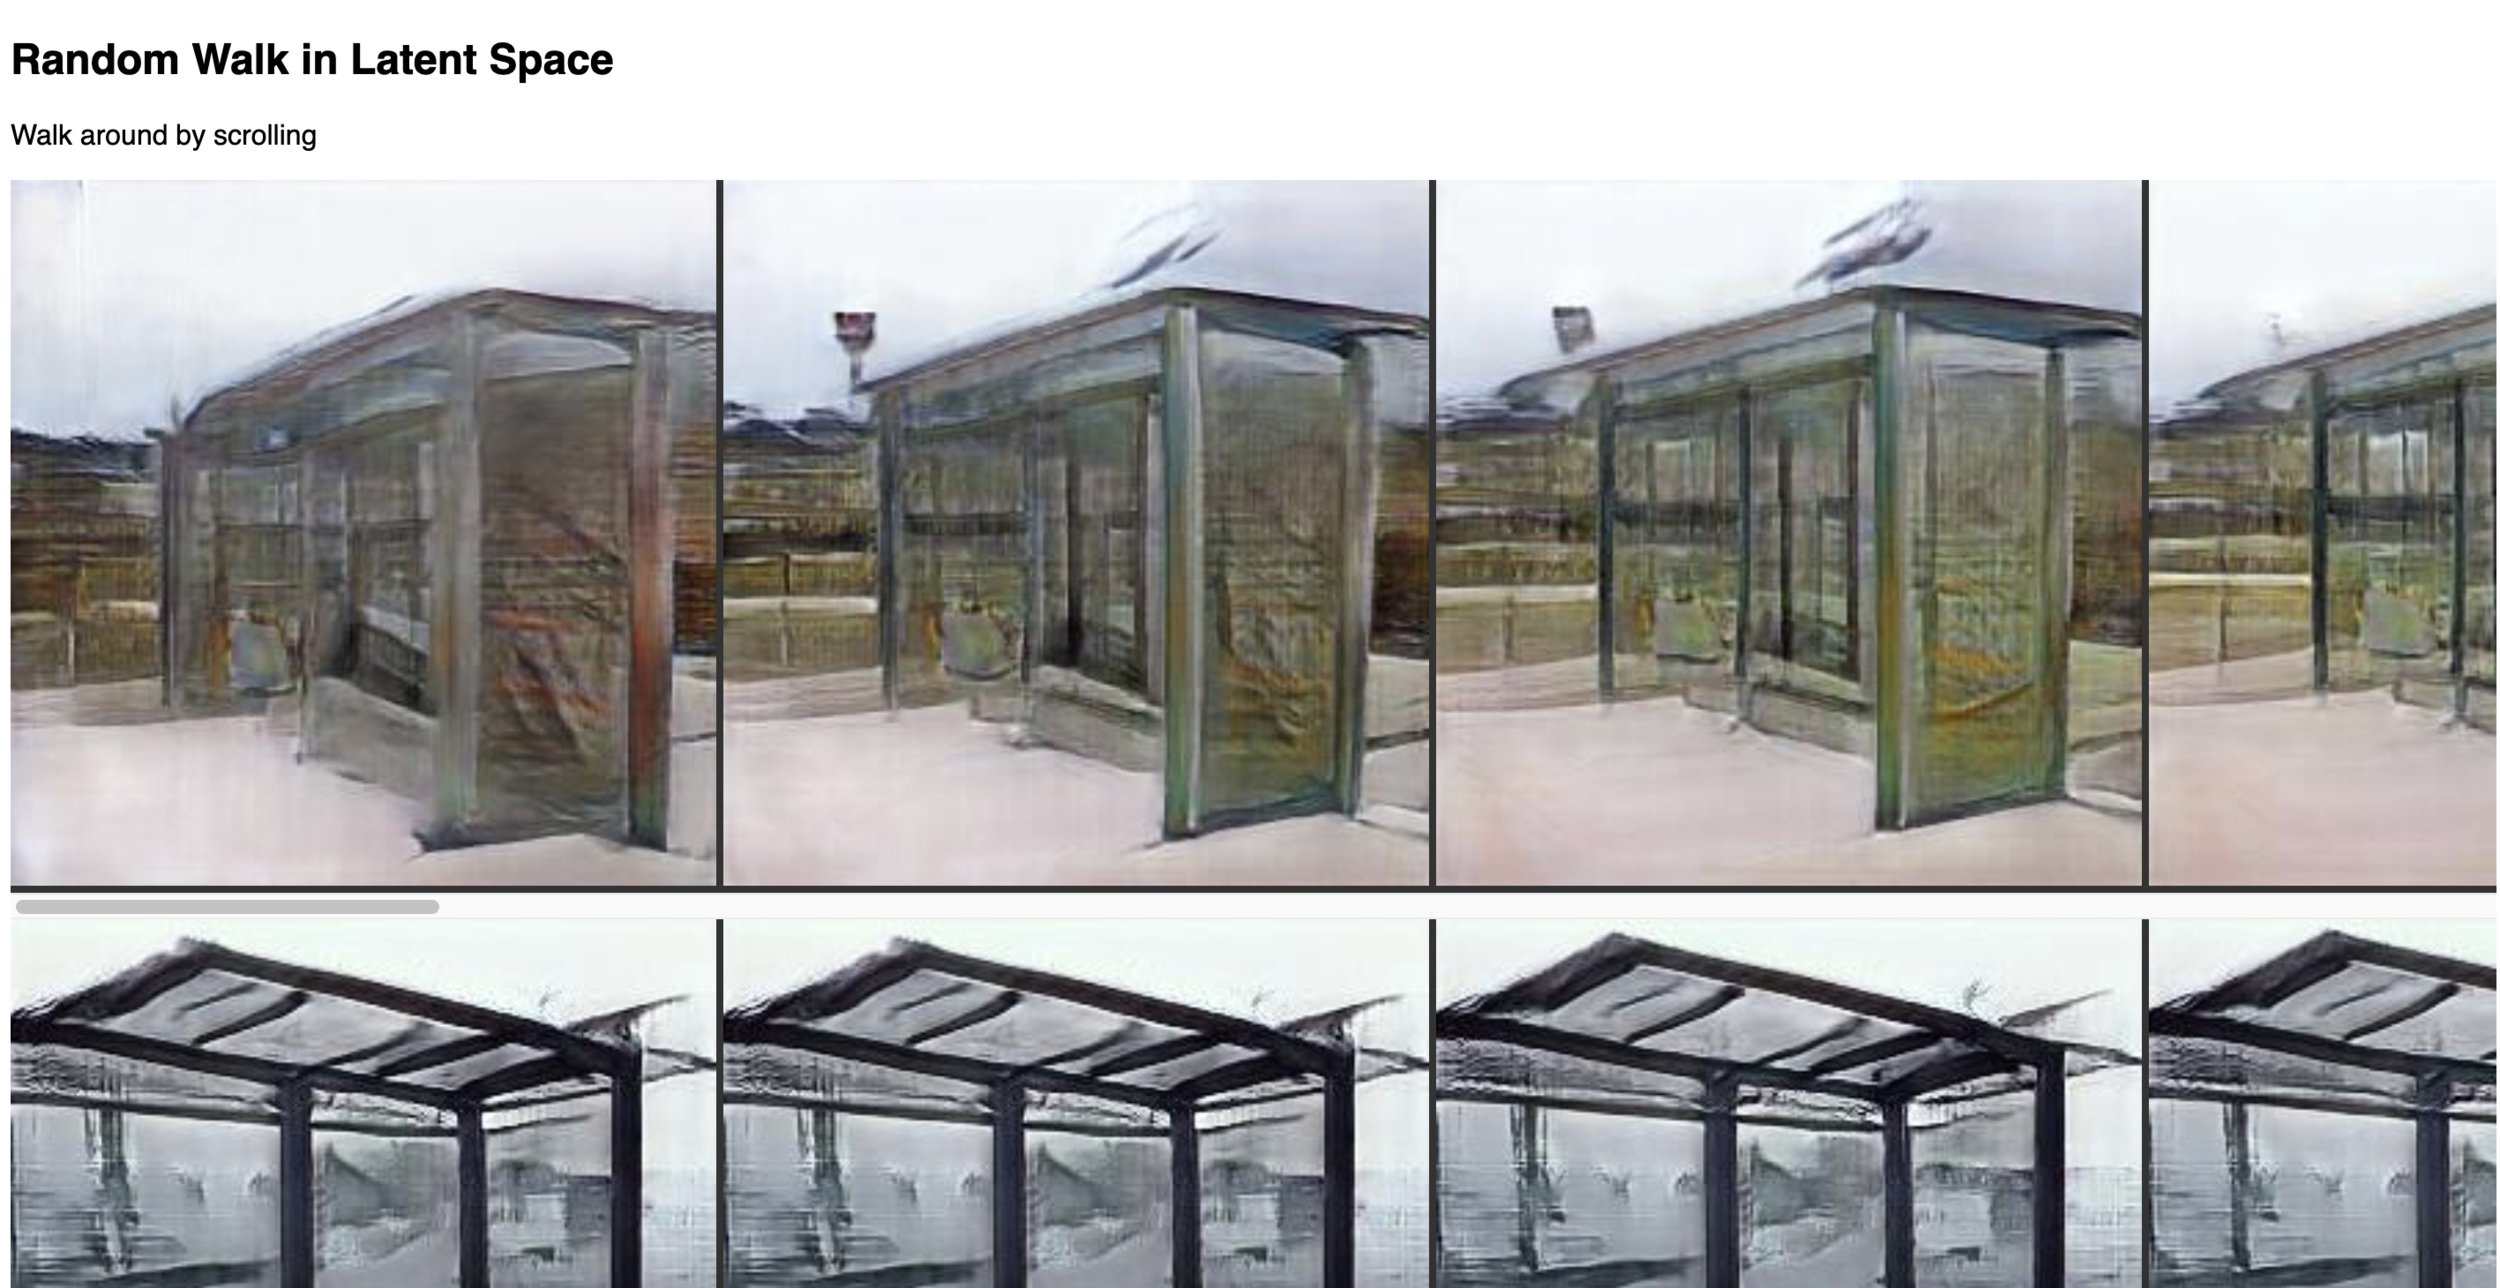
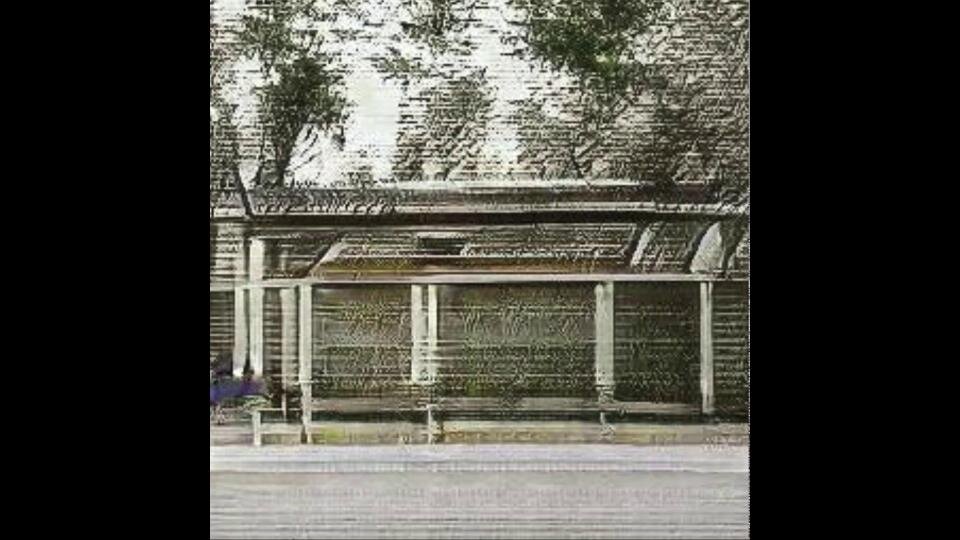
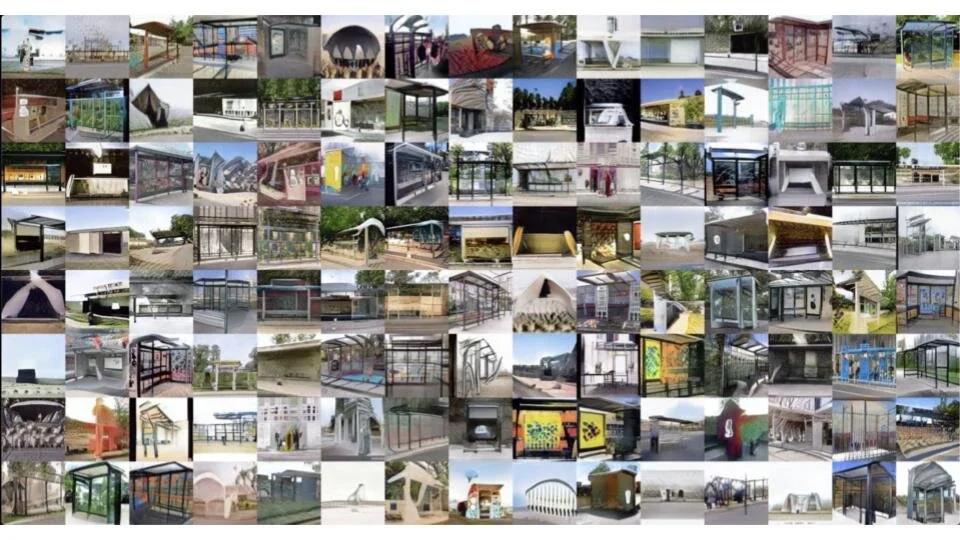
Output from the three models. Top row: images generated by the bedroom based model Middle Row: output generated by the forest based model Bottom Row: Output generated by the flower model.

Output from the three models. Top row: images generated by the bedroom based model Middle Row: output generated by the forest based model Bottom Row: Output generated by the flower model.

Open Questions/Answered Questions/Surprises

One of my questions was whether AR can be effective in this type of setting - I thought that I would have more answers after this project, but I think that I won’t really know until I run the workshop or do more user testing.

I was also curious as to whether the transfer from the GAN image to a would be successful in seeing the process behind and question the steps involved in . I think that they were successful in showing that the same data used with different methods and algorithms can have very different outcomes and tell different stories. I think that it also effectively asks the question of whether the final product was made by an algorithm or human designer and prompts thinking about new design processes.

I was surprised by how much the 3D model output felt changed from the over-utilized GAN aesthetic images - I think I’d like to try to continue pushing this forward in other work. I was also surprised by the difficulty of using Unity to create a simple AR app!

Future Steps

I received very helpful feedback that it could improve the structure of the workshop to focus it more on a specific issue or location. I’d like to do some research on what this could be, ideally something local. I would also like to run this workshop soon, perhaps at ITP’s Unconference in January. I think running it would be very to better understand what works about this as a workshop and what doesn’t. I would also like to refine the design of the workshop booklet and seek feedback on the questions before running the workshop.

Links

My final presentation can be found here.

Final Project Proposal

For my final project I plan to continue my bus stop collection project.

One of my initial motivations for this work was that I believe that physical objects can be useful in grounding conversations around an intangible or invisible subject (such as algorithms and machine learning in this case) and for bringing questions into a tangible form. I hope to focus on this aspect for my final project. So for the further development of this project, I plan to design a piece that could be a standalone installation or held as a workshop. Below is a diagram of the setup (please excuse the scratch paper!):

IMG_1974.jpg

Each marker card when looked at through a phone will show a 3D model of a bus stop in augmented reality (that I will model using Oculus Medium based on the output from the GAN). There will be a prompt card in front of it asking the viewer to think and speculate about elements of its design such as: Who is it designed for? Who was it designed by? Where is it located? What is it optimizing for? On the back of the card will be the actual parameters (dataset, etc). There will be another card (or maybe this is all one foldout card?) with a reflection which could be more questions or an explanation of the design process. I will aim to make three models in total (in a more finalized version I would like to have closer to five). In a workshop setting this could be done in groups and conclude with a share-back.

This approach is also inspired by Design Fiction methods (as described by Stead et al in Spimes Not Things. Creating A Design Manifesto For a Sustainable Internet of Things) - a similar school of thought to Critical Design and Speculative Design, but meant for public and participatory settings through media rather than fine art galleries and museums.

I hope that this could also be an exercise towards rethinking design systems and what kinds of human-machine tools would be possible in this area with new developments such as machine learning - as said by Laura Kay Devendorf, a creative expansion.


Acts of Noticing: Final Presentation

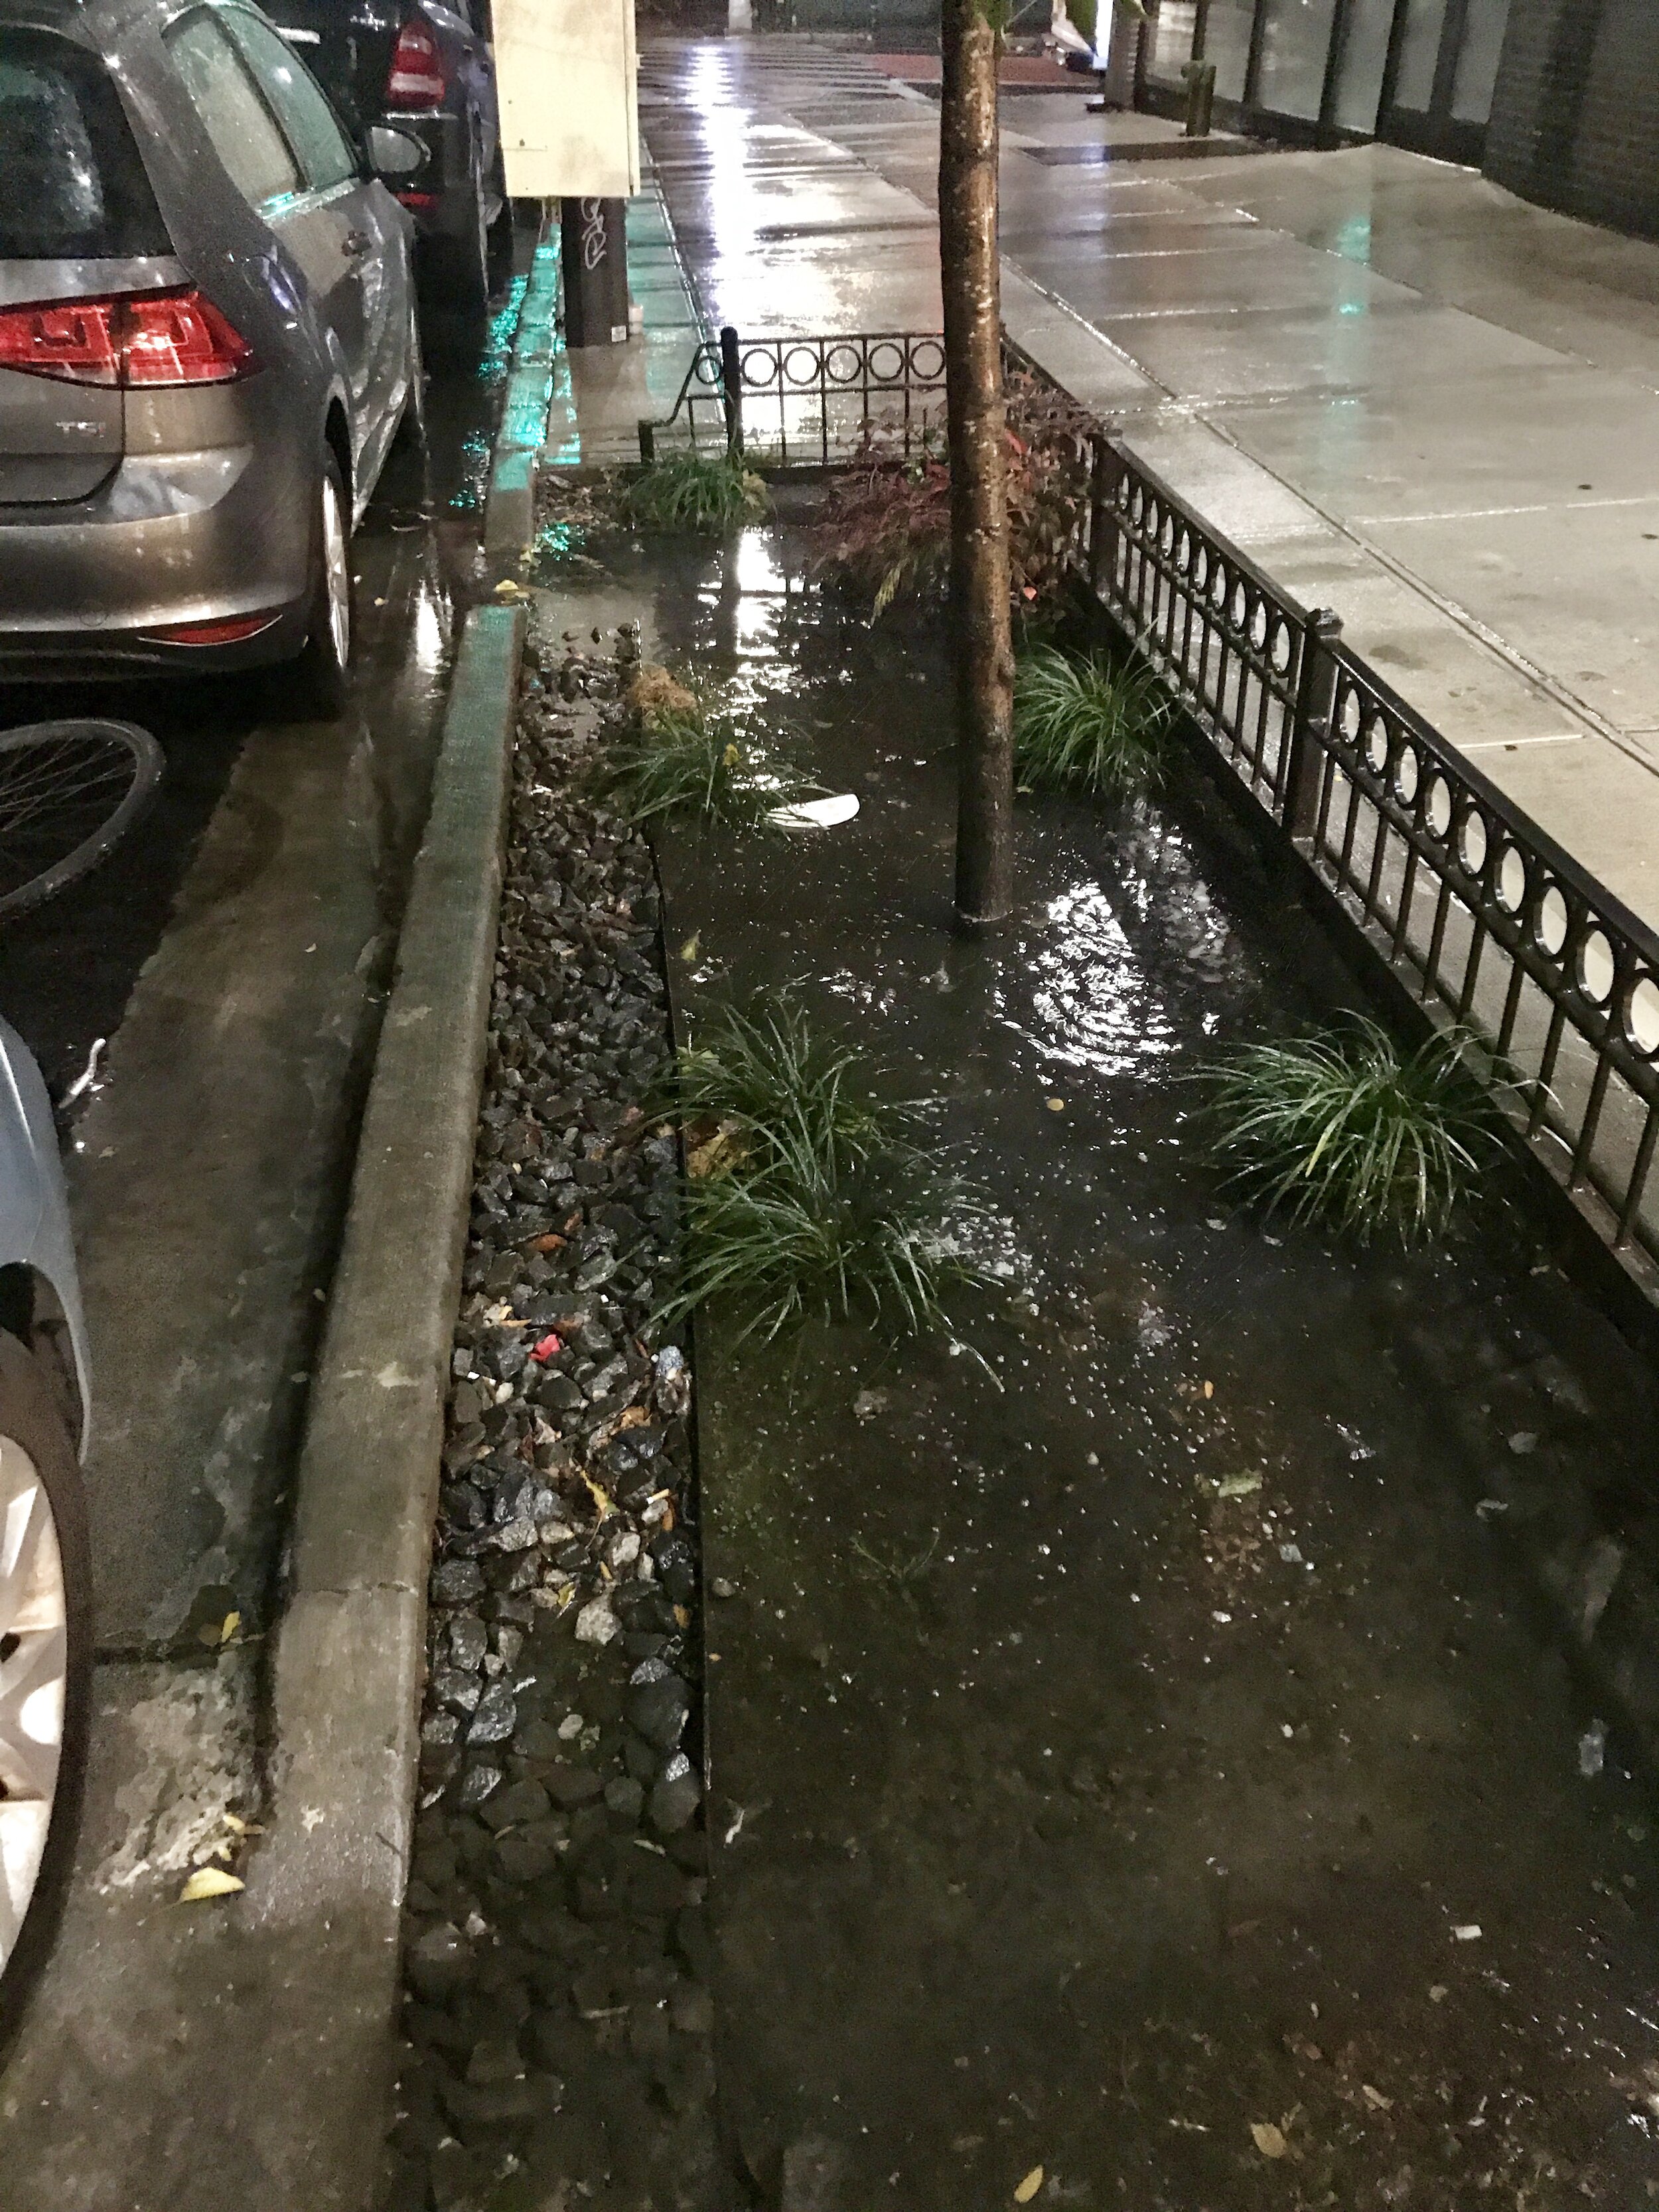
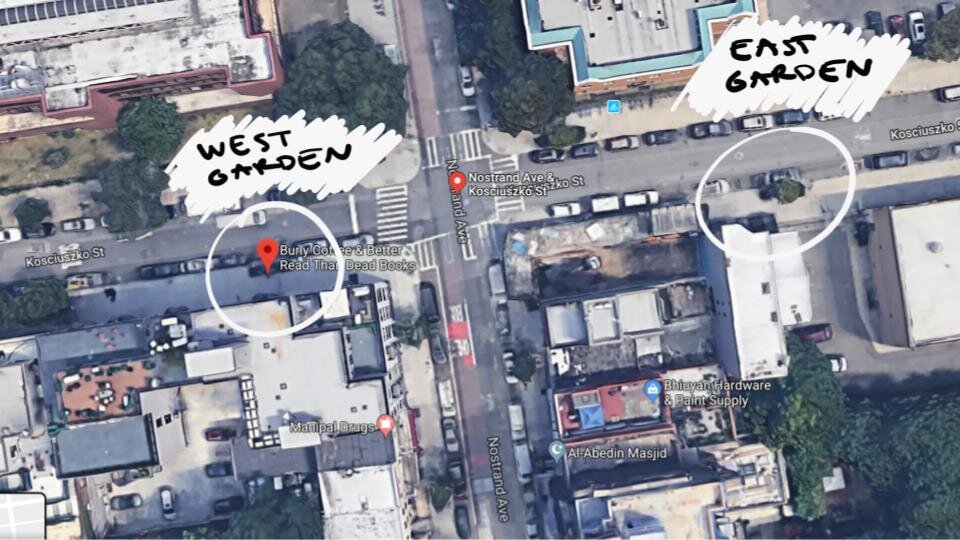
For my arts of noticing project I observed two rain gardens on Nostrand and Kosciusko over the course of the semester. I started by first researching the city’s green infrastructure and then visiting eight different rain garden sites in my neighborhood. I chose this site because it was in a spot that wasn’t too busy or too quiet and I liked the idea of being able to compare the dynamics of the two gardens.

I was particularly interested in the following questions from the assignment prompt:

What can you learn from its dynamics? What are the opportunities and challenges it faces?

My approach was to notice, observe and get to know the gardens through many different methods. This included:

  • Drawing the gardens both on paper in person and digitally drawing on photos of the garden

  • Taking inventories of the trash and sewer status

  • Recording sound

  • Counting the number of people who passed by

  • Taking measurements such as soil moisture, humidity and temperature

  • Measuring water level/flow

  • Taking photos of the garden and elements

  • 3D scanning the garden elements

  • Using iNaturalist to identify the plant species

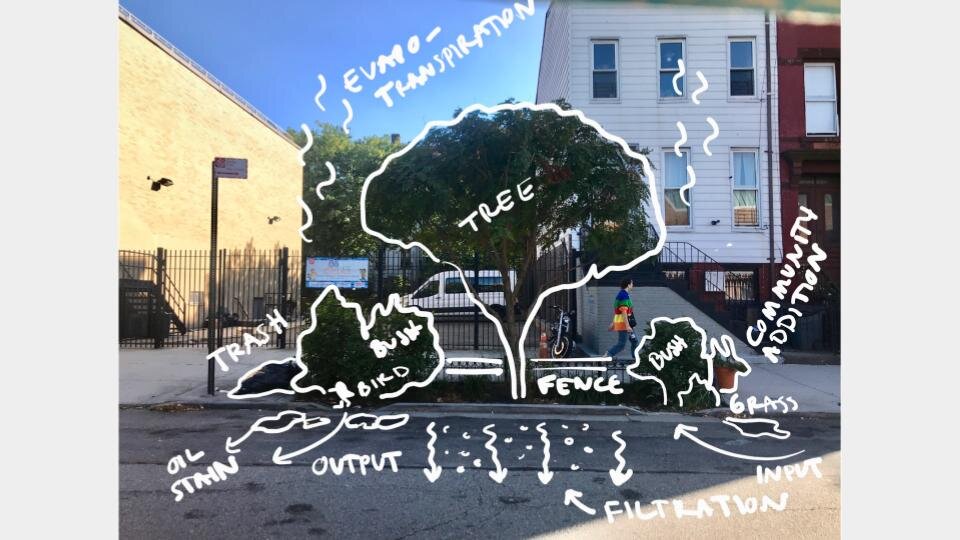
  • Mapping inputs and outputs

You can see my week 7 update here, which includes many examples of these.

In order to bring all of these observations together I decided to make a website that acted as a research journal of sorts. I wanted the visitor to feel as though they were exploring and getting to know the gardens themselves. The visitor hears sound I recorded upon entering the garden page and can navigate the garden by clicking on different hyperlinked spots (indicated by blue circles). The visitor can also compare the gardens using this method of exploration as well. This design was heavily inspired by the hypertext project My Body by Shelley Jackson.

You can visit the site here: https://lydiajessup.github.io/noticing-site/


The code is on Github here: https://github.com/lydiajessup/noticing-site

urbancode.jpg

Inspired by Urban Code: 100 Lessons for Understanding the City, I decided to condense these observations into a set of rain garden codes. Urban Code distills city dynamics into simple movements and relationships in order to better understand them and learn from them. My hope is that these rain garden codes could be a source of insight or point of departure for further research or infrastructure development as the city expands its green infrastructure.

RainGardenCodes_fullcolor-01.png
RainGardenCodes_fullcolor-02.png

I also printed these as posters using the riso printer (and thanks to Andrew!!) - thinking of them as something that either could serve as a collectable/decoration item or a public poster (similar to the MTA PSA posters).

IMG_1953.jpg
IMG_1954.jpg

Collection: Post Natural Bus Stops

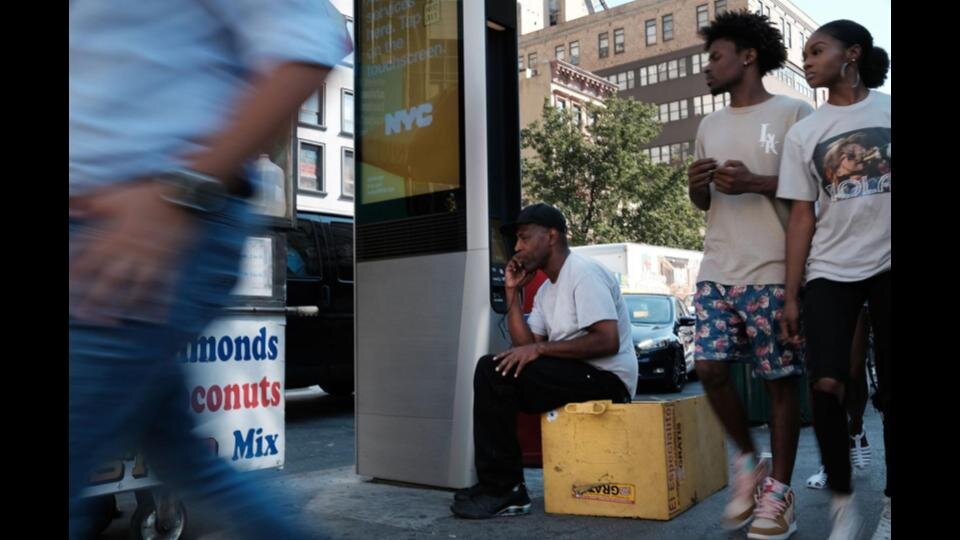
For the past few months, I have been collecting photos of bus stops. This came from an idea to re-design the LinkNYC kiosks using machine learning (and specifically a GAN model as a design tool.

I was motivated by these structures because I always wondered why they had to be the same boring color and shape as the sidewalk - there are already enough gray and shiny rectangles in this city! There are a bunch in my neighborhood and people drag out crates to sit around them, charging their phones or browsing the internet. Why wasn’t a seat built into the design? Why weren’t they designed to be social? Could they be? These are meant to be internet hubs specifically to “bridge the digital divide,” but because they are outside, they are harder to access in the winter or when it is raining. Why weren’t they designed with this challenge in mind? And they are so uninviting that many (higher income) New Yorkers don’t even know what they are even though they have useful resources for everyone! And why is the portal for people to use a tiny ipad that you have to lean over to read but the advertisements are displayed on two enormous 50 inch screens? People made each of these design decisions - if we start using algorithms in design, how will these priorities be encoded?

linknyc.jpg

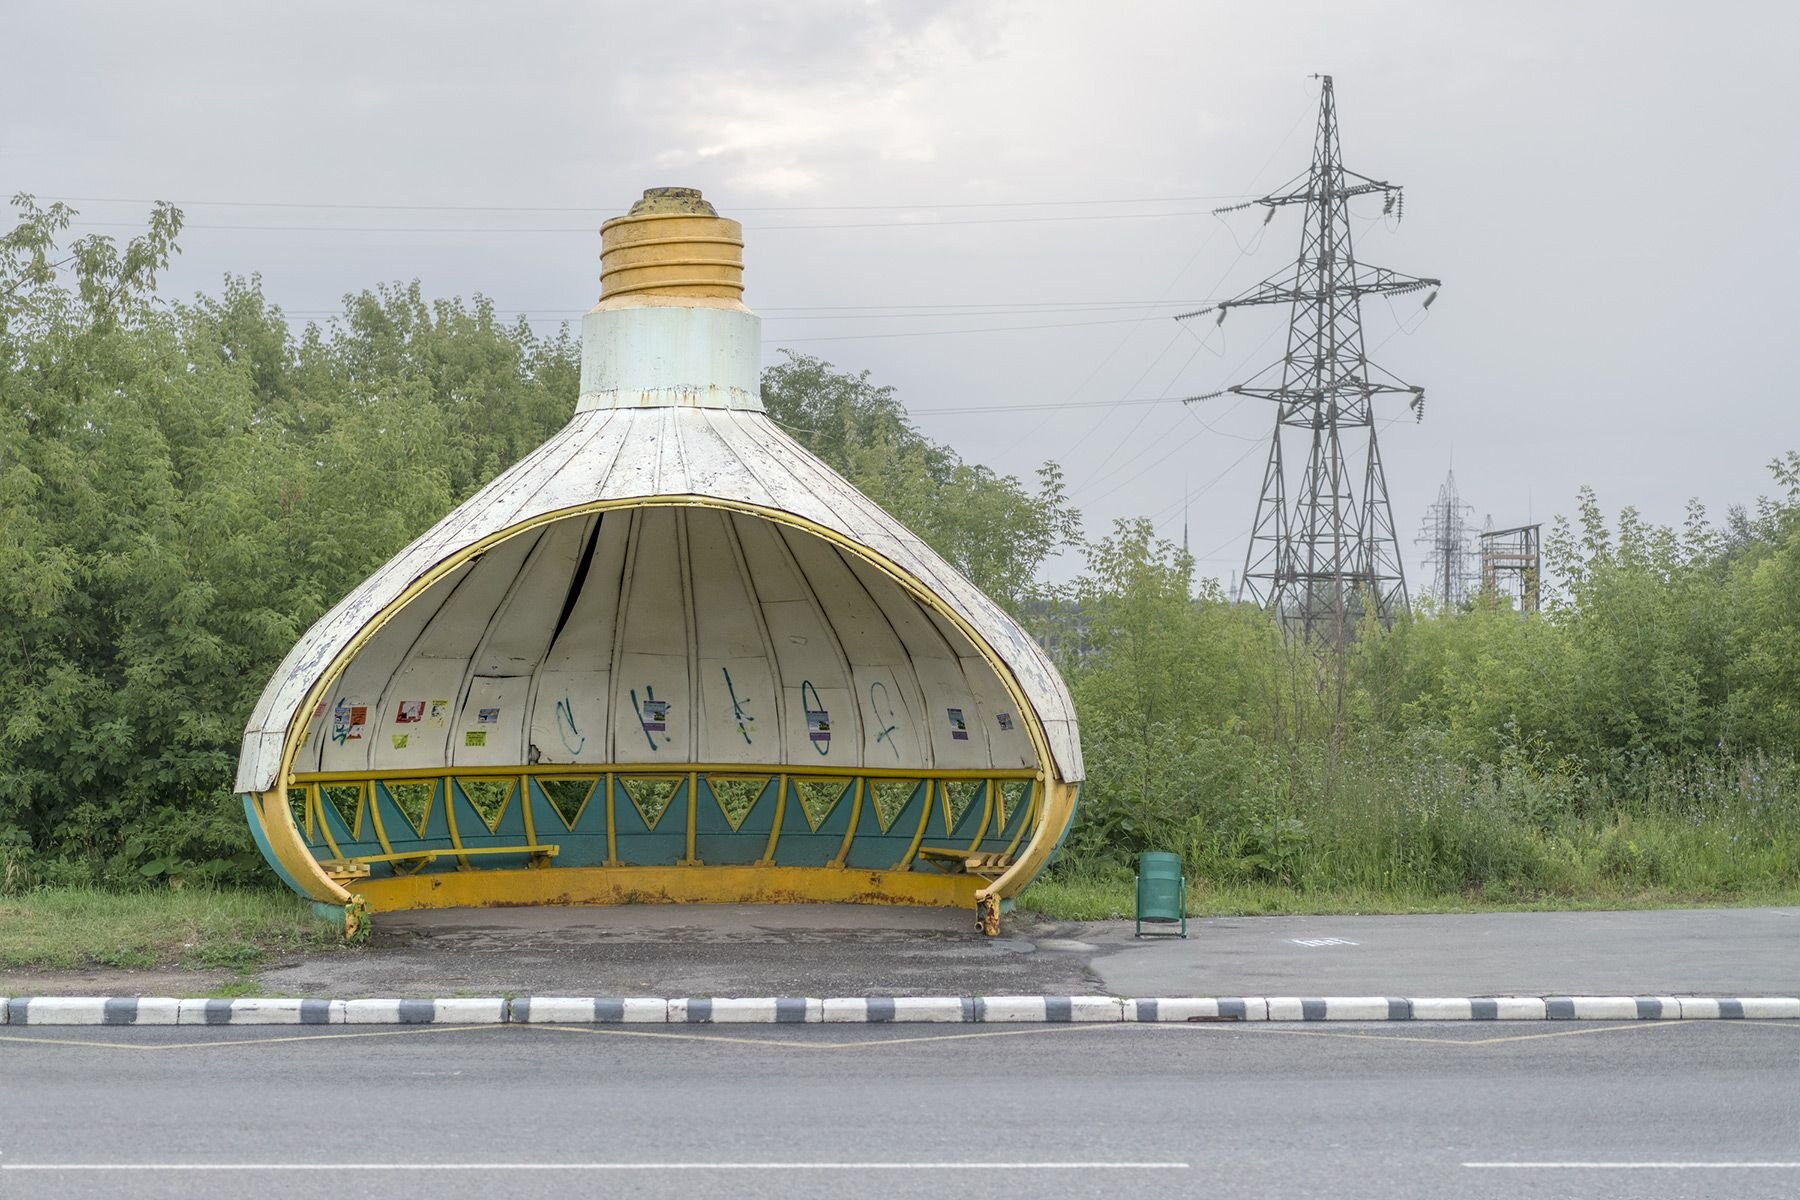
However, but there aren’t enough of similar objects worldwide to create a dataset large enough for machine learning. I decided to focus on bus stops instead because they are another example of public service structures built for people (the term social infrastructure is also sometimes used) and they are much more common. I was also inspired by the soviet era bus stops that my friend recently showed me. Why can’t/shouldn’t bus stops look like this?
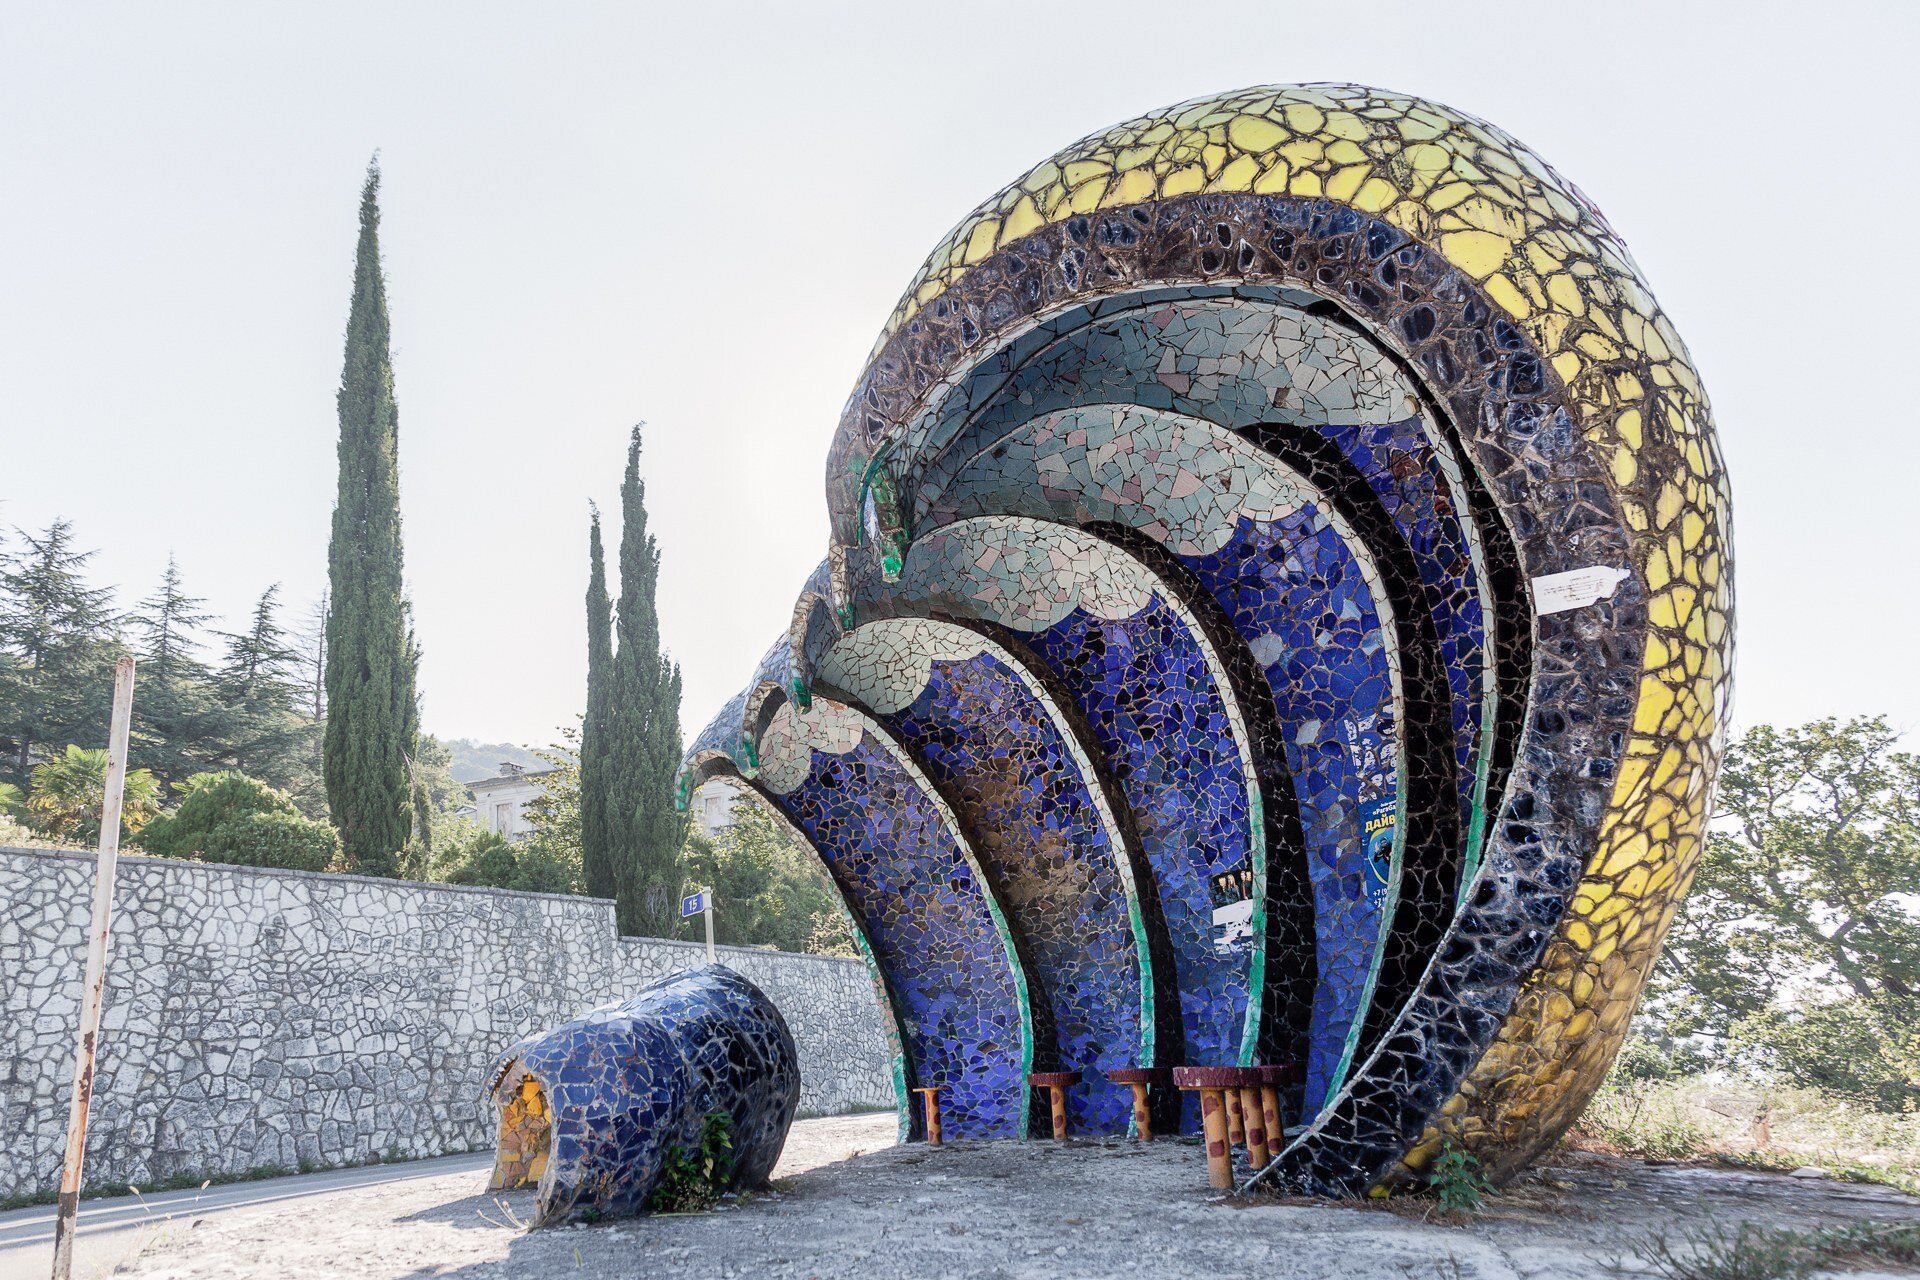
For this project I decided to formalize this collection and create an interface in which the ML generated bus stops can be explored.
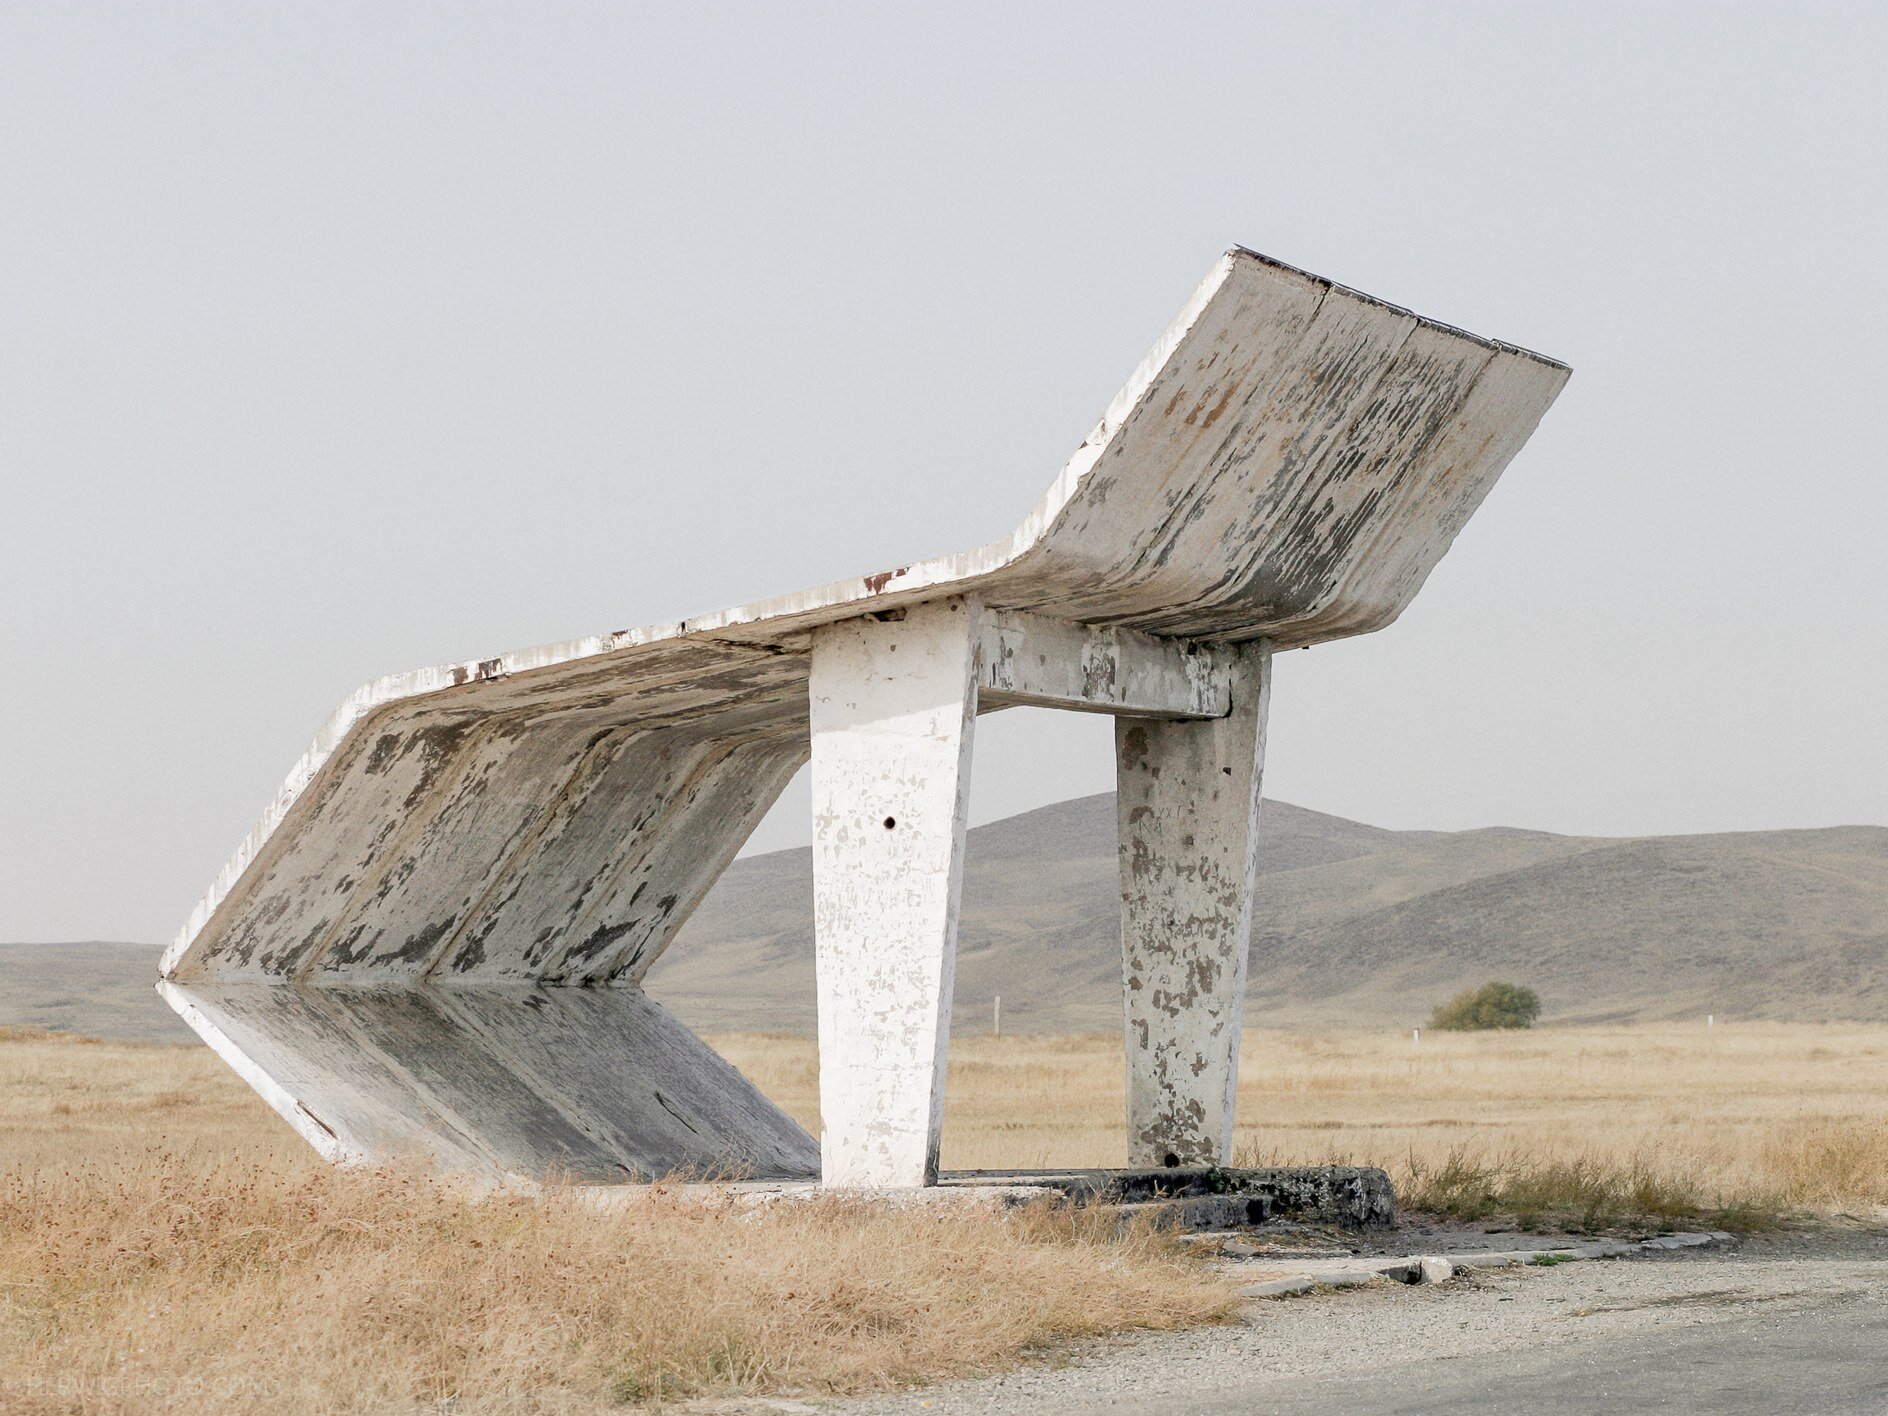

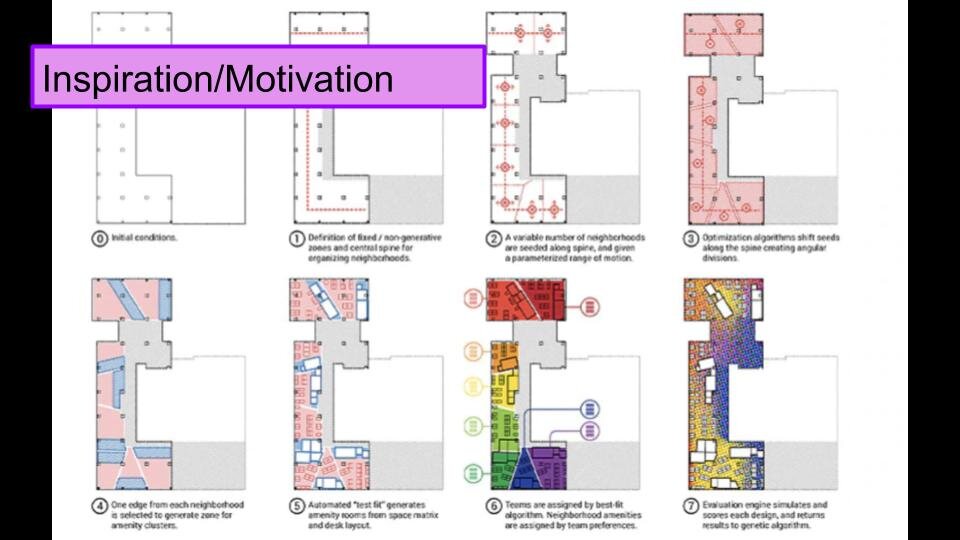
The process is inspired by a podcast I heard about theAutodesk officesbeing designed using machine learning.

autodesk2.png

and the Chair Project by Phillip Schmitt at Parsons that used machine learning to generate new chair concepts.

thechairproject.png

I tried using the flickr scraper to find bus stop images, but decided to stick with a Google Chrome extension that gave me more curatorial control in the download process (rather than going through after the fact).

Then I ran the photos through Tega’s python script that I modified slightly to crop them to the center square area before resizing. I ended up with 692 processed images.

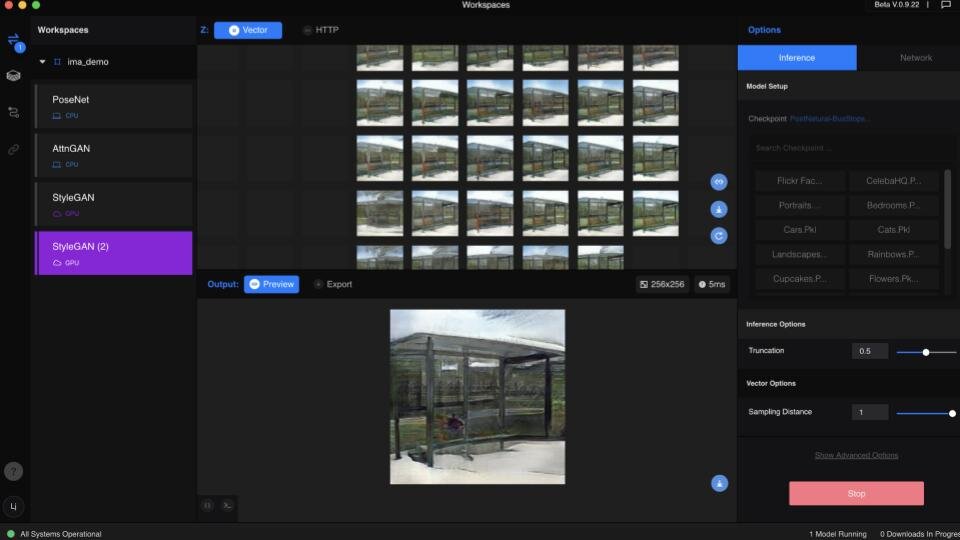
For the GAN training I used a beta feature in Runway (thanks to Ellen and the Runway team!). This feature allows you to use transfer learning to train on top of an existing model. I chose styleGAN and trained my bus stops on top of the bedroom model.

Runway makes this very easy to do. I uploaded the photos and then pressed “train.” It took 3 hours in total. I first tried this with a smaller subset of the dataset thinking it would be faster, but when I trained it with the full 692 photos it took the same amount of time. I did get a different result however (I didn’t include the Soviet bus stops in the first round, so they were much more standard-looking).

Screenshot 2019-11-11 21.24.57.png

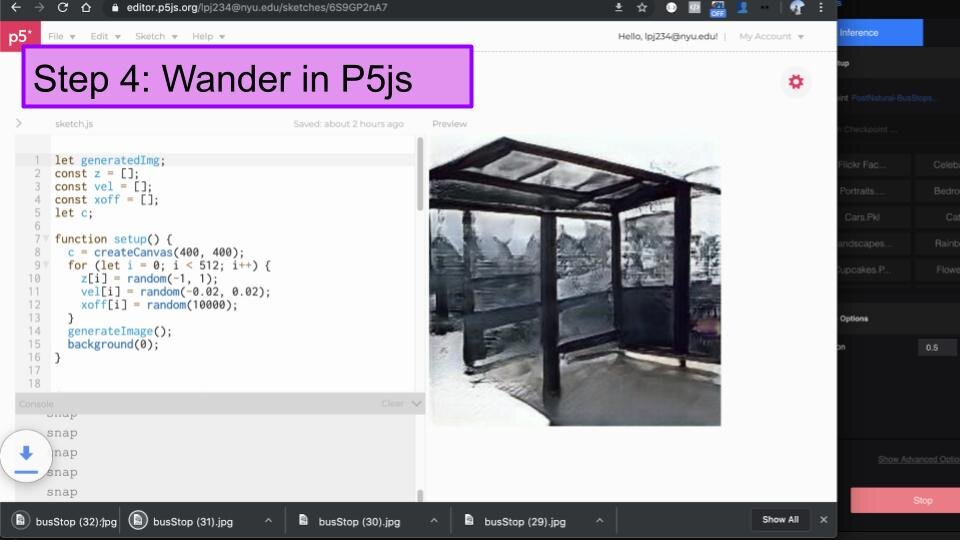
When I had the trained model, I used a p5 sketch Dan Shiffman wrote to connect to Runway and pull the resulting photos into the web browser and “walk” around in the latent space.

Here is the result:

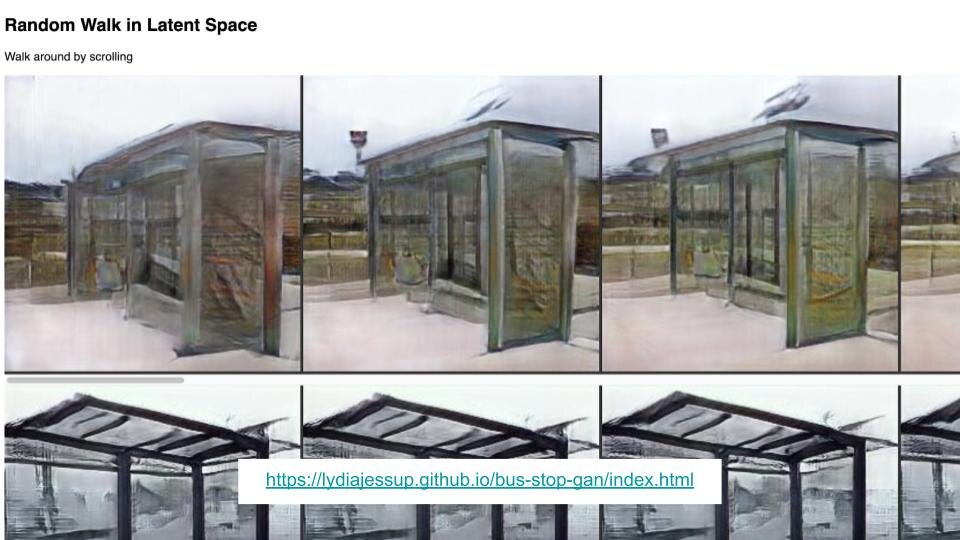
The code also downloads the photos so that you can make an animation. I used these to make a simple website that lets you scroll through the latent space. I wanted the viewer to feel a bit lost and overwhelmed by the output and see this part of the result of the GAN process which is often hidden. It also introduces friction into the workflow (I’m hoping to use this for design, but it could be used in other cases) by forcing the human to manually go through the photos to find the ones that they want to use for whatever reason. The website doesn’t include all of the output, only approximately 300 photos.

Screenshot 2019-11-13 00.23.23.png

The code also downloads the photos so that you can make an animation. I used these to make a simple website that lets you scroll through the latent space. I wanted the viewer to feel a bit lost and overwhelmed by the output and see this part of the result of the GAN process which is often hidden. It also introduces friction into the workflow (I’m hoping to use this for design, but it could be used in other cases) by forcing the human to manually go through the photos to find the ones that they want to use for whatever reason. The website doesn’t include all of the output, only approximately 300 photos.

I also like that this output is a collection of photos but has multiplied the size of the original collection by orders of magnitude and also obscures the original collection, leaving the viewer wondering and having to guess at what it was - and I hope more explicitly prompting questions about what is behind design decisions.

You can take a walk through this latent bus stop space here: https://lydiajessup.github.io/bus-stop-gan/index.html

Next Steps

  • I think that if I were to continue this project forward, I would need to be more intentional about fair use and copyright. 

  • If I were to make another version of the website I’d like to introduce a bit more control for the use and provide some sort of indication of direction (which way they are going in the latent space - for example more straight lines or more curvy ones).

  • Another idea could be to train models separately on very different kinds of bus stops and compare the results in some way.

  • I am also thinking about a way to show the user the original dataset and allow them to look through that in a similar way.

  • I would also like to make 3D model versions of a few of the bus stops and show they in VR so that people can feel the scale of them and the effect the different design decisions have.

More


The code is for the website is here: https://github.com/lydiajessup/bus-stop-gan

The code for my version of Dan’s p5 sketch is here: https://editor.p5js.org/lpj234@nyu.edu/sketches/bKqfxxLn7

You can see my presentation slides below:


Week 7: Arts of Noticing Update

Rain Garden Observations

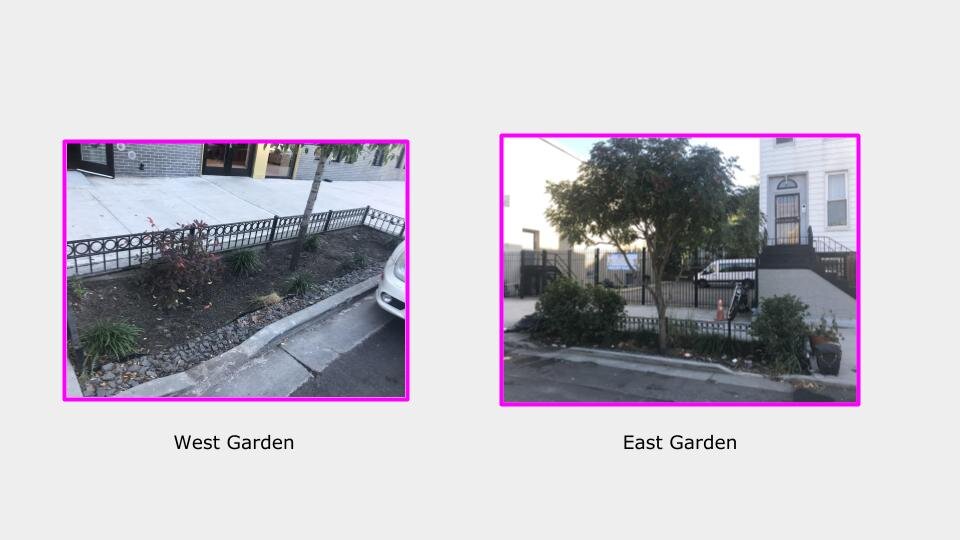
After researching rain gardens and visiting several sites around my neighborhood, I selected to observe two rain gardens near the intersection of Nostrand and Kosciuszko. I have named them East Garden and West Garden:

overview.png

Inventory

On my first observation visit, I decided to take an inventory of my rain gardens. Here is what I found, including an inventory of the trash:

West Garden

westgardeninventory.jpg

Trash:

  • 46 cigarettes

  • 5 pieces of plastic

  • 1 aluminum yogurt top


East Garden

eastgardeninventory.jpg

Trash

  • 9 cigarettes

  • 1 pom pom

  • 1 teddy graham bag

  • 1 spork

  • 1 milk carton

  • 1 lollipop wrapper

  • 1 muffin wrapper

  • 1 bottle cap

  • Multiple candy wrappers

  • 1 lid

  • 1 chips bag

  • 1 snapple bottle

  • 2 shot bottles

  • 1 apple core

  • 1 paper towel tube

  • 1 glasses cloth

  • 49 unidentified

Boundaries and borders

As porous piece of infrastructure that is embedded into the landscape of the city and interacts with other systems, I am particularly interested in understanding the different boundaries of the rain garden. I am particularly looking for evidence of border crossings and have already found a few examples:

Little bird!

Little bird!

  1. Bird: While I was observing the East garden, I scared away a couple birds that were sitting under a bush. Once I moved to the side a bit one of them returned and a second one joined it. They seemed to be eating, picking up little pieces of something. Just as quickly as they came, they left again.


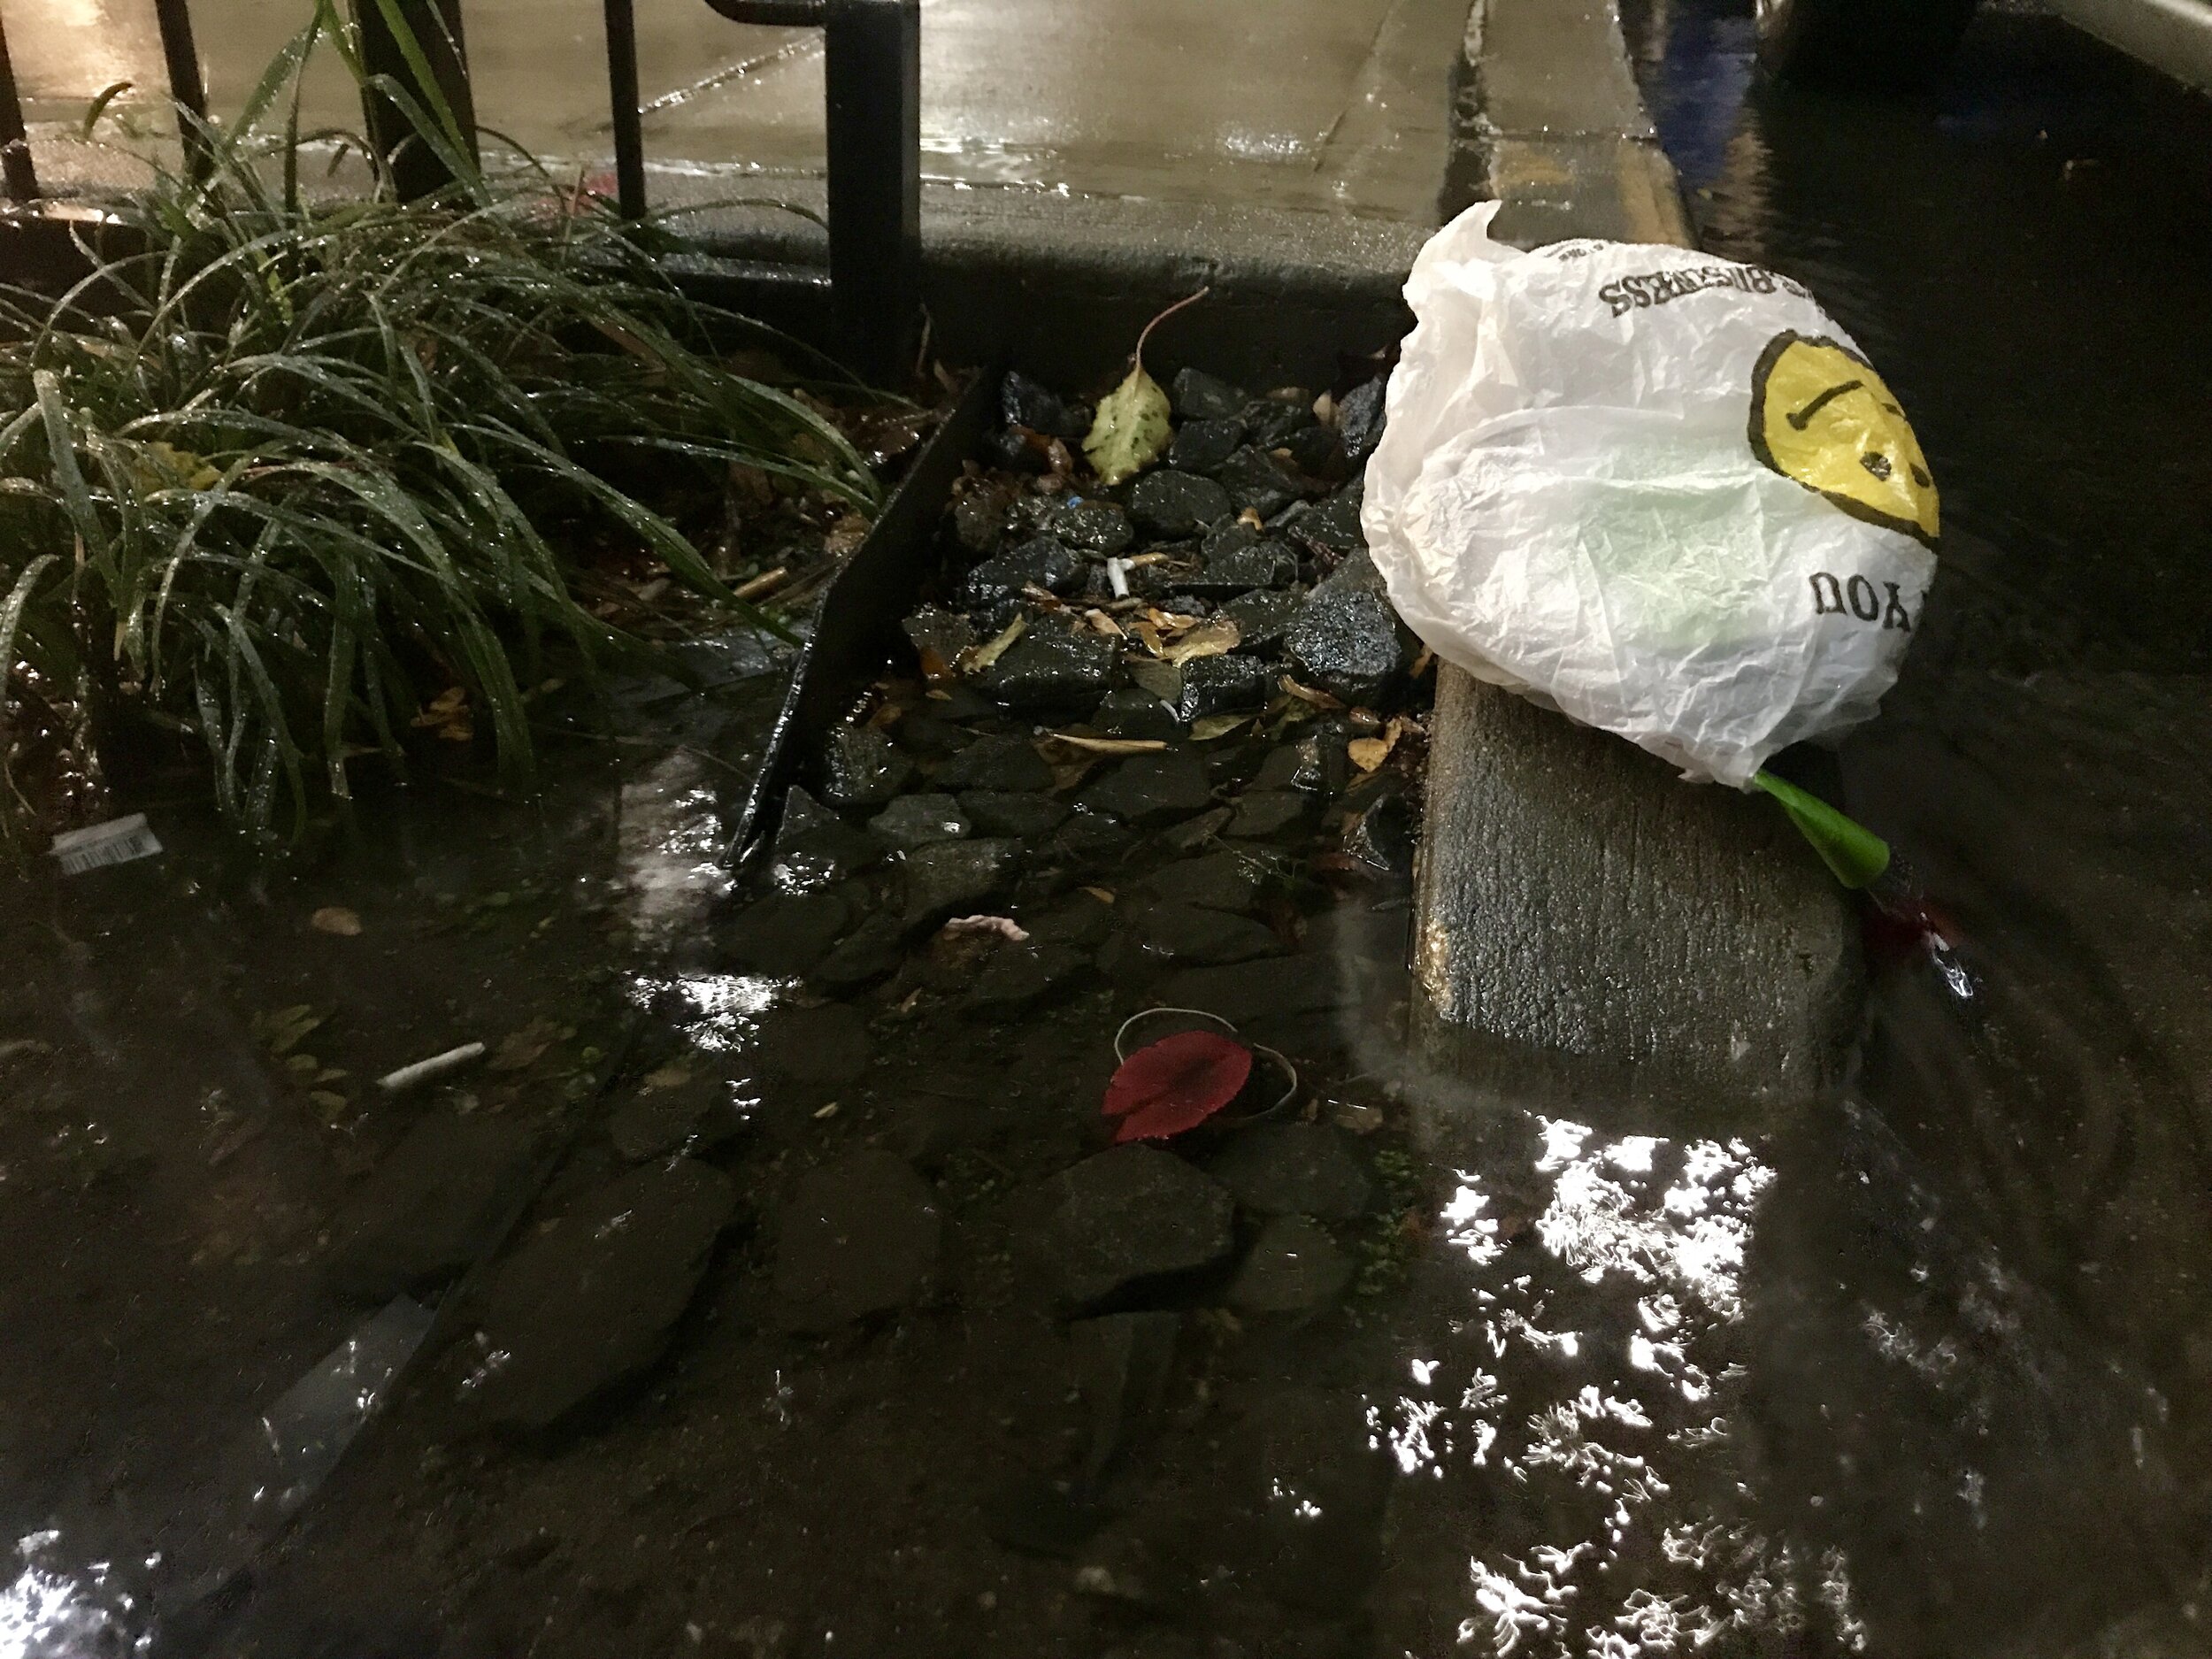
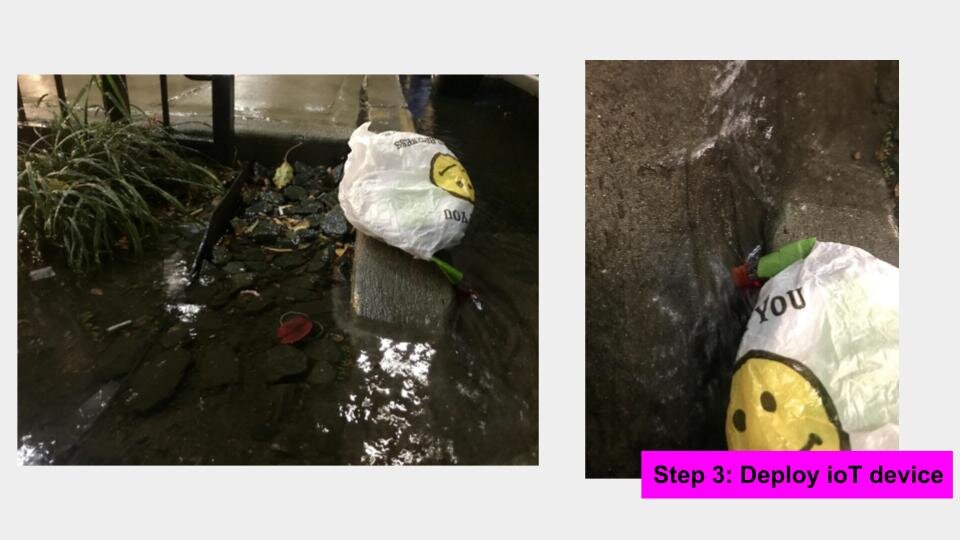
  1. Evidence of water: After a rainstorm, I found evidence of water entering the rain gardens. From the marks in the soil, I could see a clear path of water flowing down and into the garden from the street. I could also see what looks may be a high water mark - the leaves had been rearranged into new patterns from where they were strewn earlier in the week. There was a line of leaves that seemed to have indicated a high water mark and a couple new clusters where they looked like they had been pushed by the water.

[photos]


Evidence of “high water mark”

Evidence of “high water mark”

Evidence of flow into the raingarden

Evidence of flow into the raingarden

I have also been drawing different boundaries in order to explore how they all overlap in one place:

inside garden.png
outside garden.png
trash.png

Sound

On my visits I was very aware of the sounds around me as I observed the garden. I have also noticed that these change depending on the time of day and day of the week that I visit. When I first chose this, but I find notw that there is quite a lot of activity on teh  treet. So on one visit, I spent time listening closely to these sounds. Below is what I heard:

  • Caw of crow

  • Birds chirping

  • Car idling

  • Cars on busy street

  • Music from car

  • Laughing on phone

  • Music from cafe

  • Trucks on street

  • Whistling

  • Hammer

  • Bike passing by

  • Wind rustling leaves

  • Car diving by

  • Kids in stroller

  • Man with cane

  • Man walking with music

I recorded a 1.5 minute clip for each garden to capture some of these:


After a Rain

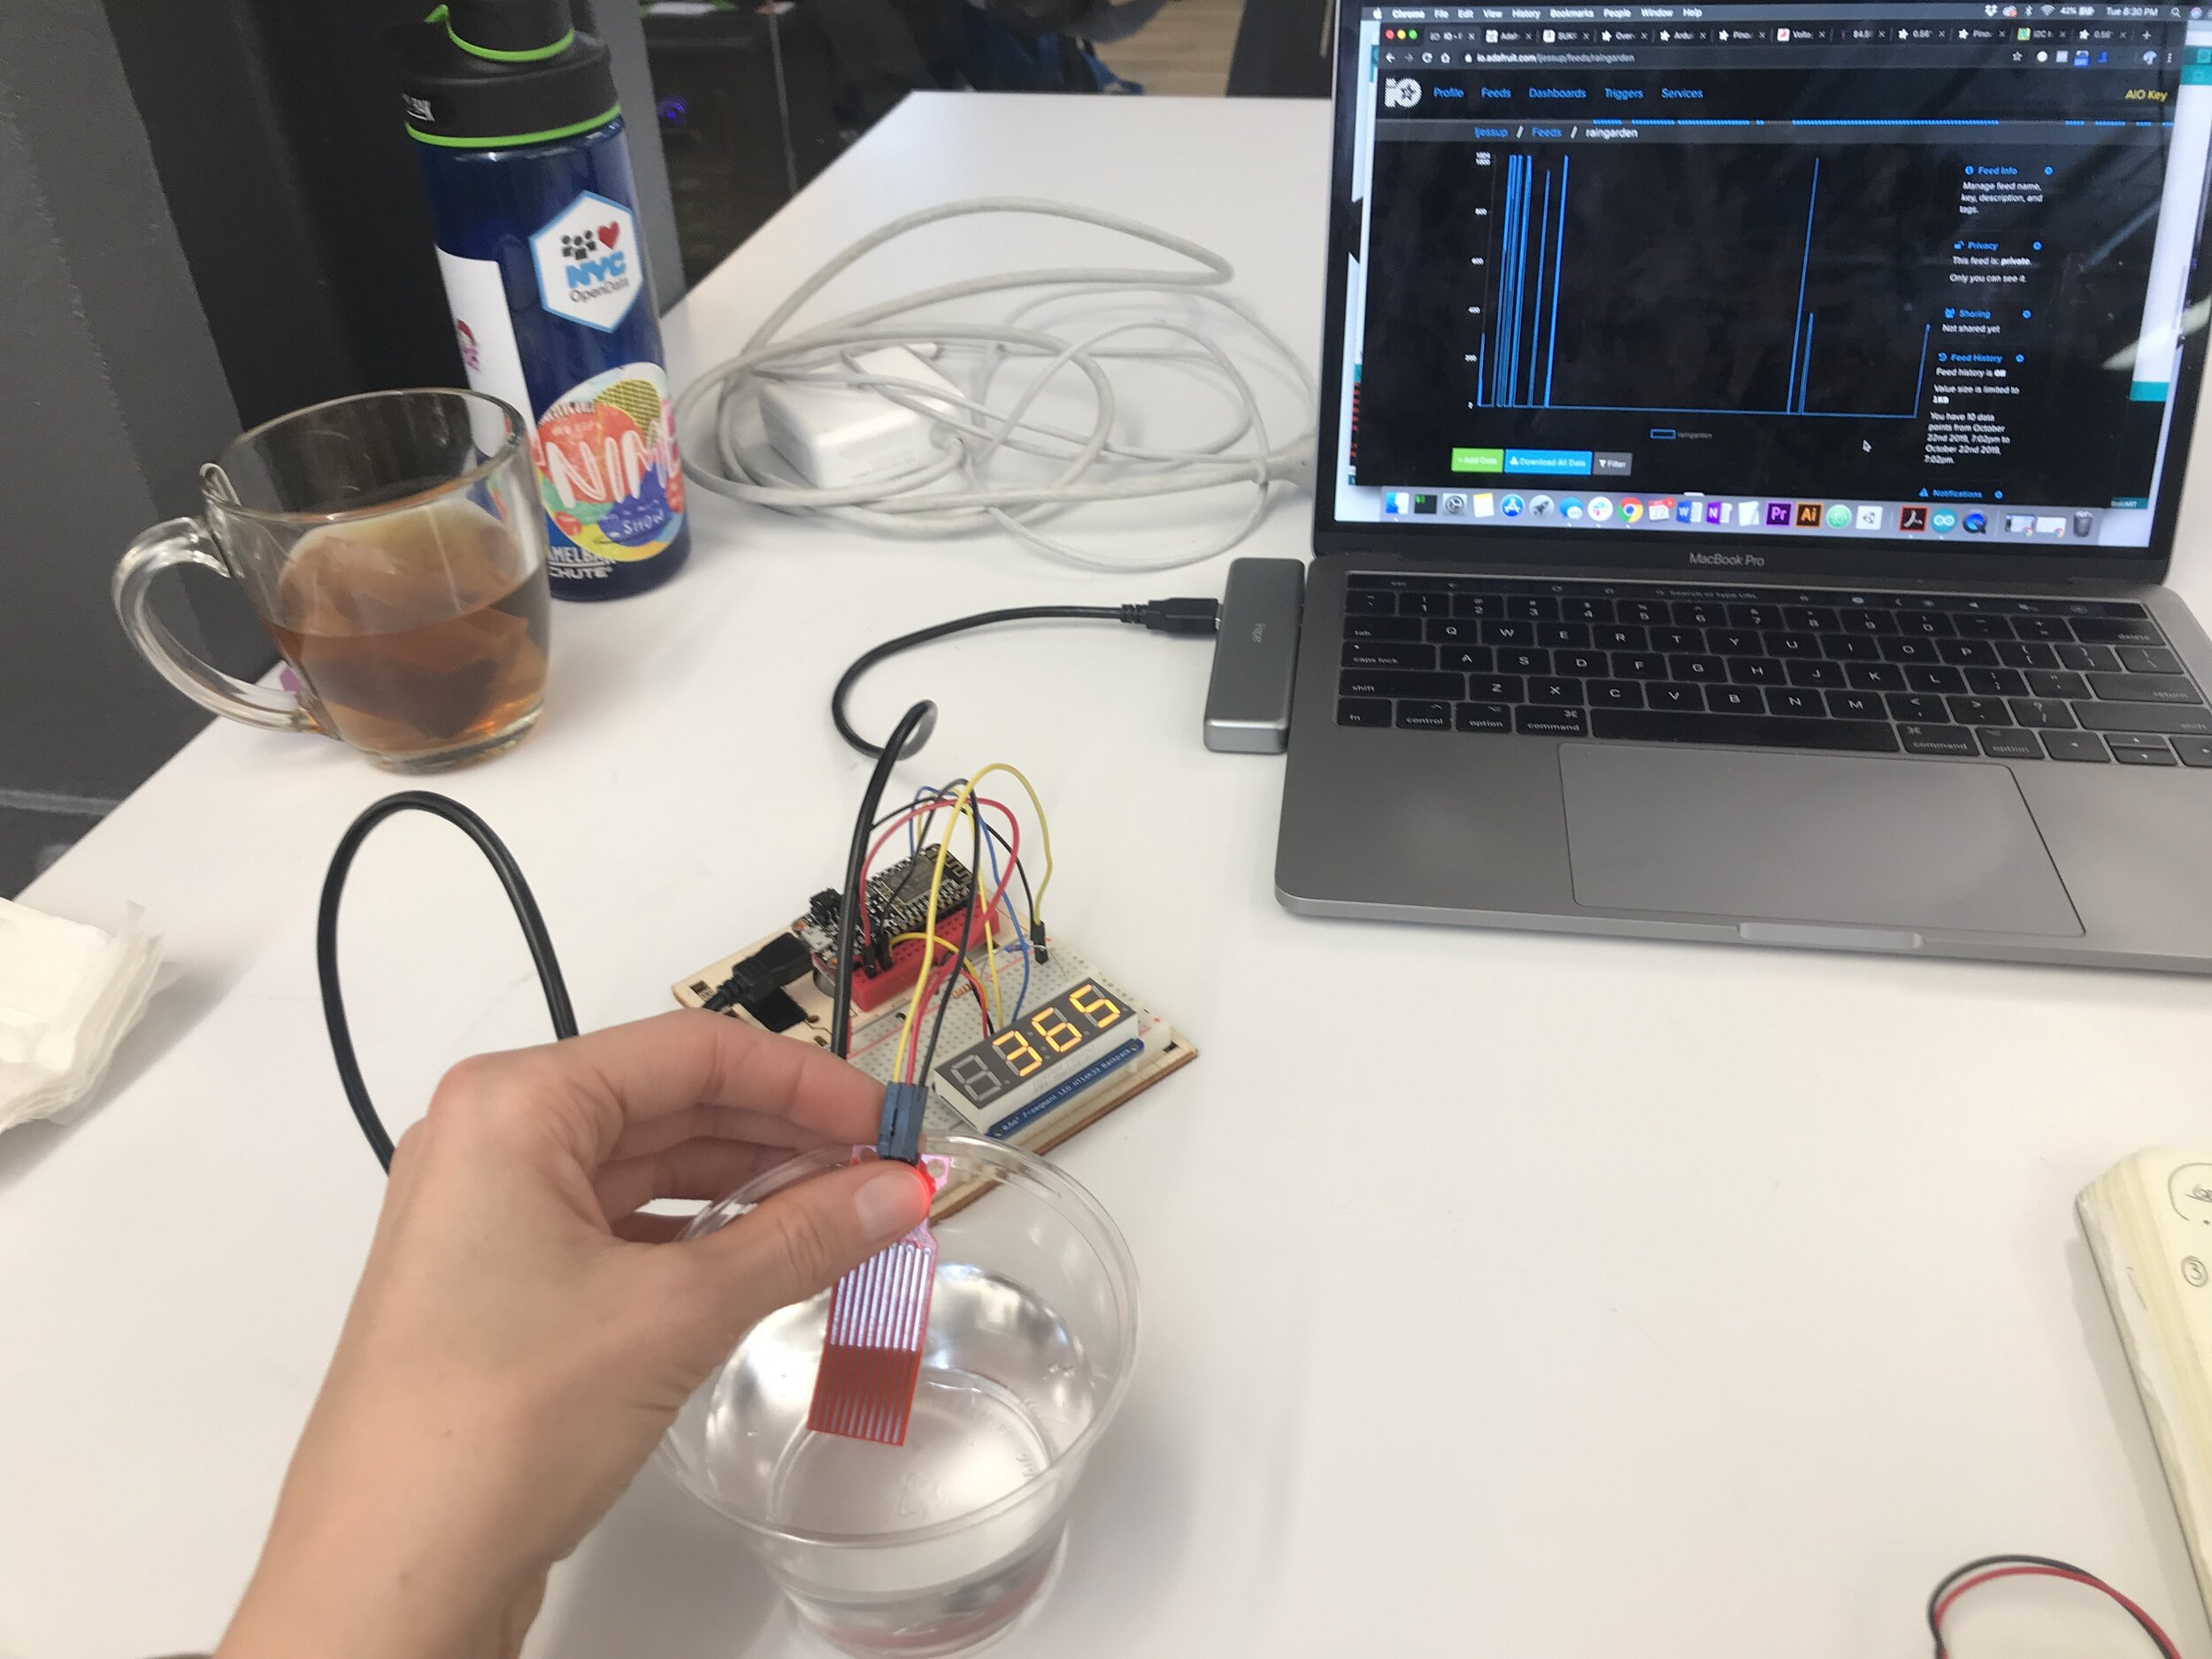
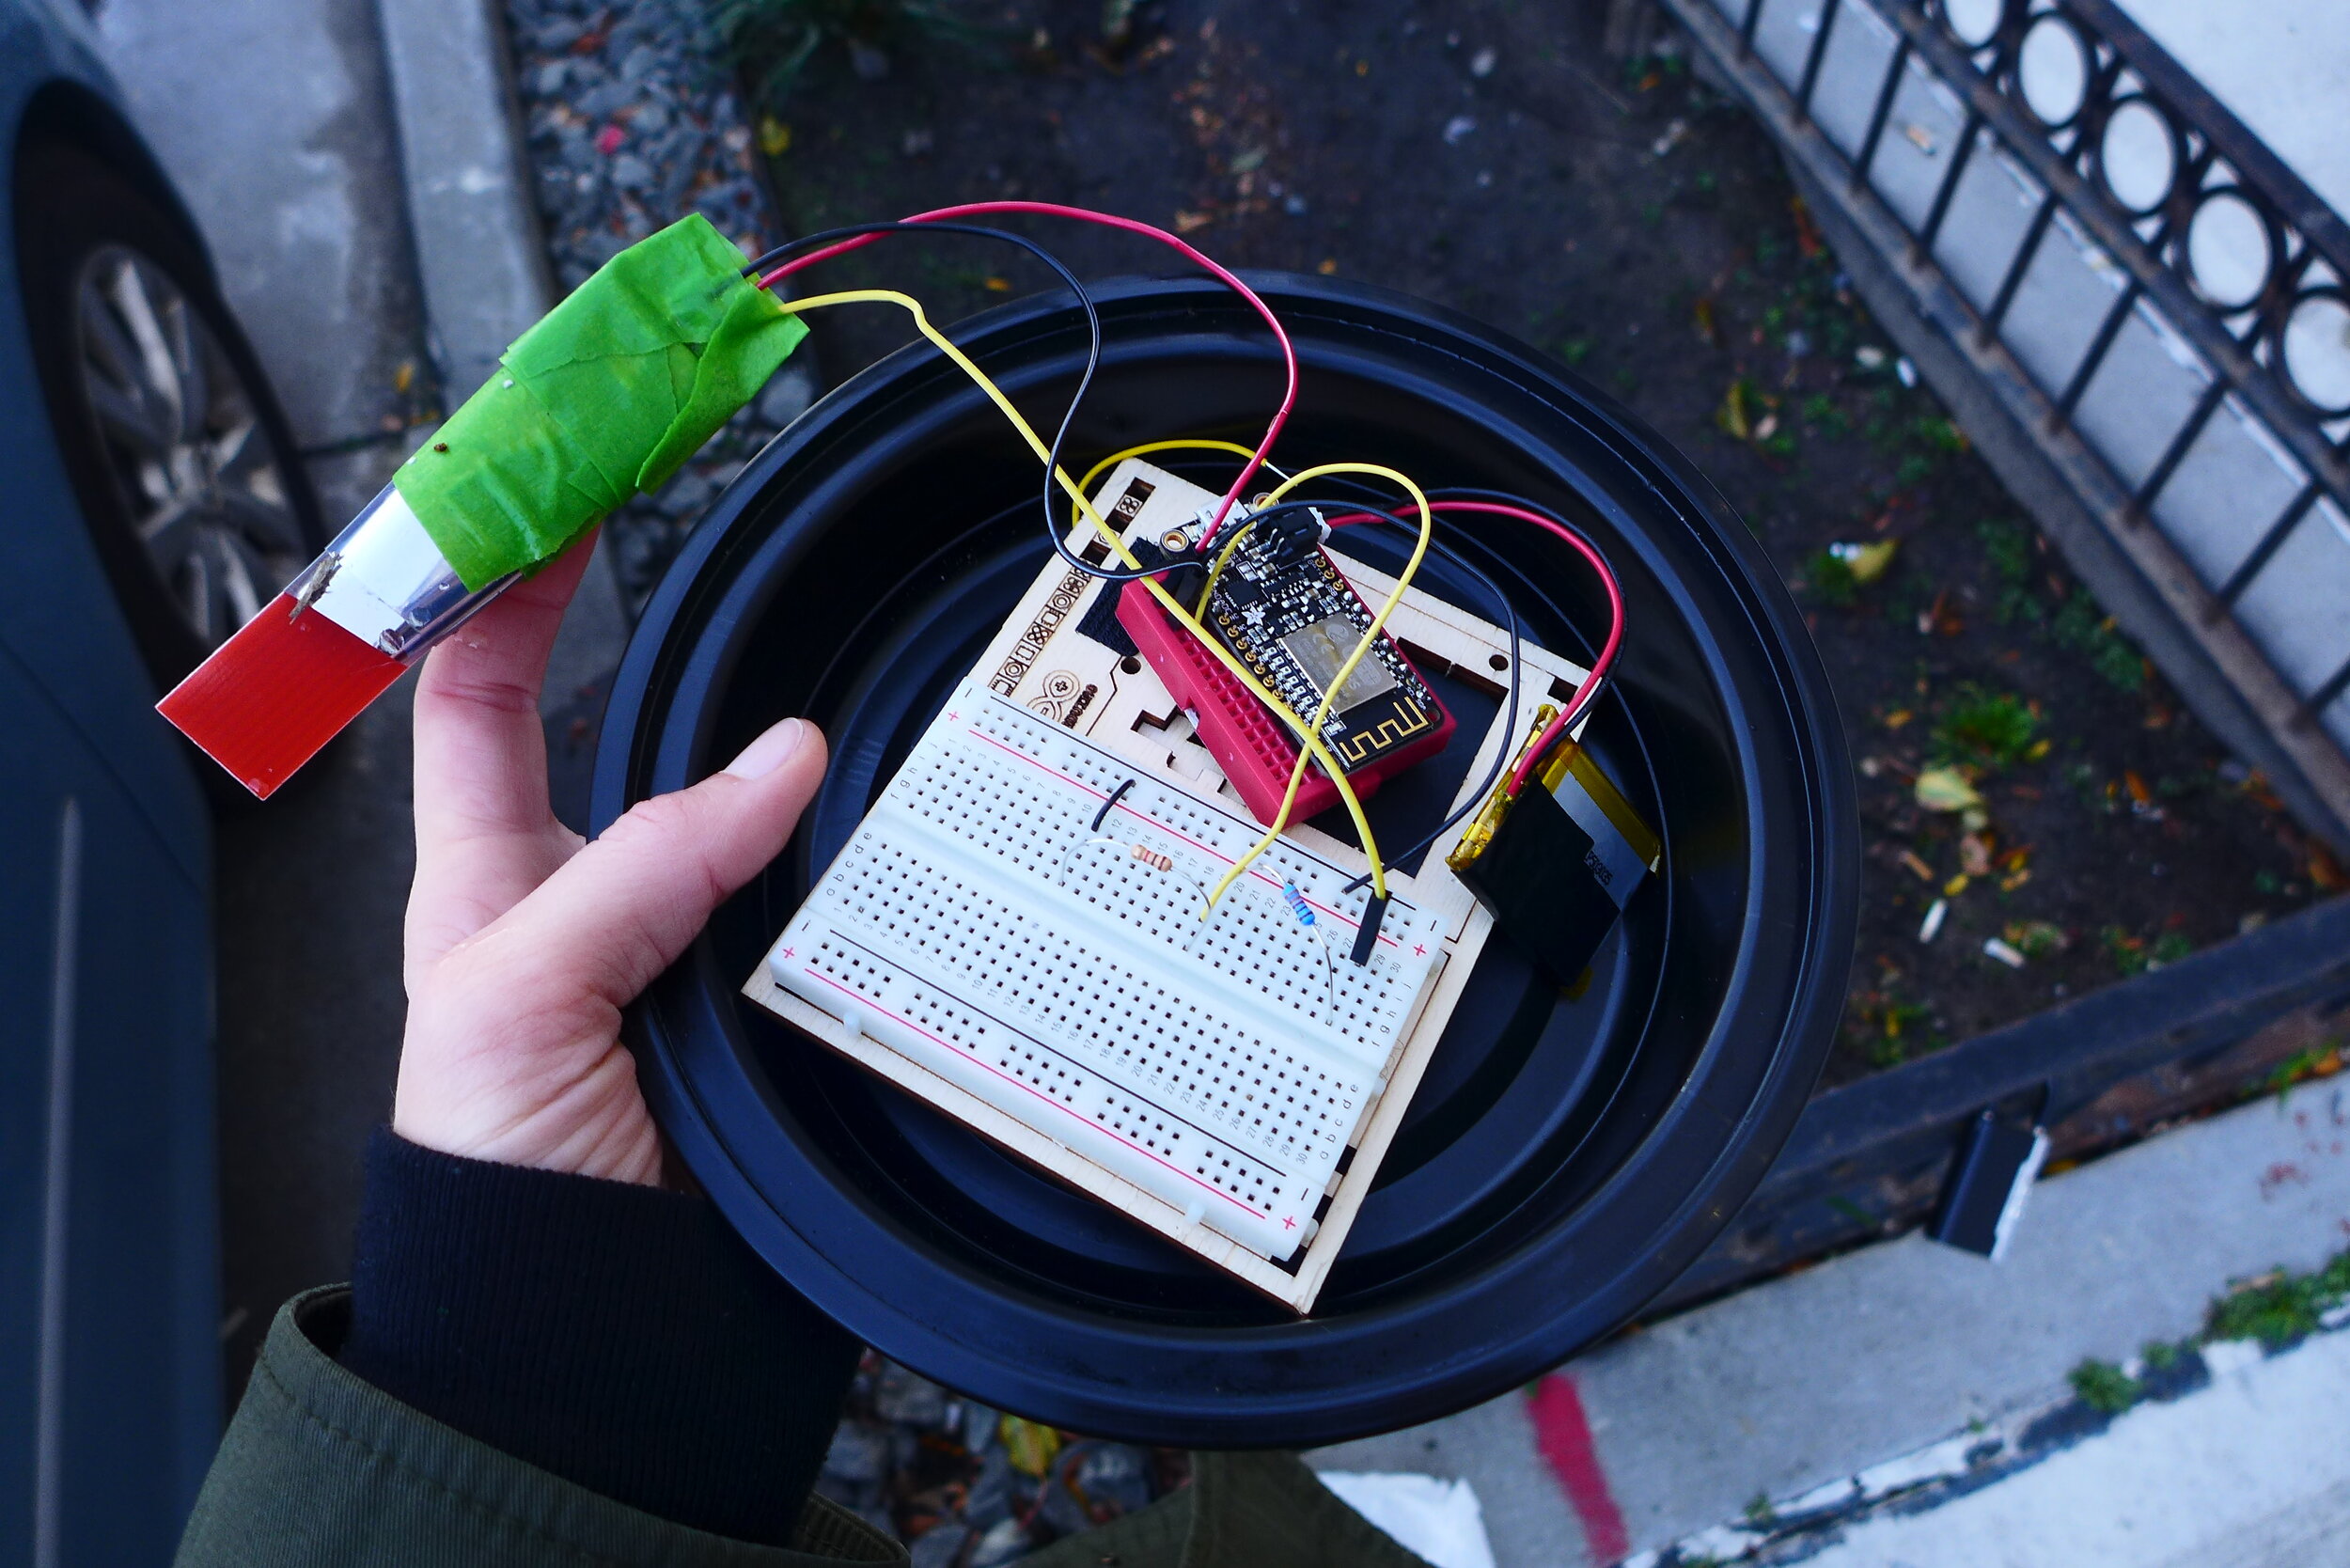
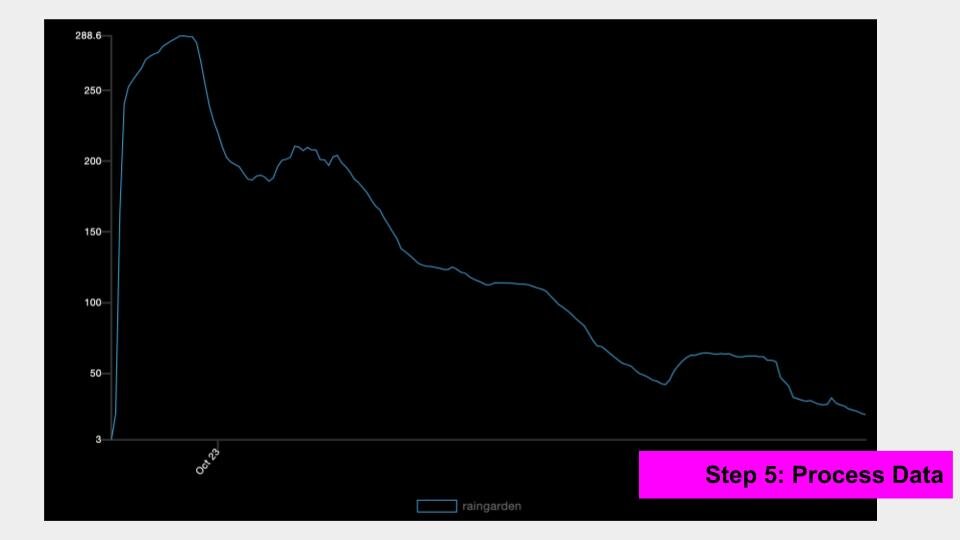
I visited a the rain gardens after a big storm to record the moisture levels using the device I made for the measuring device assignment. Here were their measurements:

West Garden

IMG_1313.JPG
  • Input area

    • Moisture ranged from 358-566 - on a second measurement when I placed the sensor farther into the soil it read 288 (this is high)

    • Temperature: 53.50 degree F

    • Humidity: 58.23%

  • Output area

    • Moisture: 270 (this is high)

    • Temperature: 57.2 degrees F

    • Humidity: 58.23%

East Garden

IMG_1315.JPG
  • Input Area

    • Moisture: 386

    • Temperature: 56.70 degrees F

    • Humidity: 57.74%

  • Output area

    • Moisture: 433

    • Temperature: 57.90 degrees F

    • Humidity: 56.94%


Reading Response: Time

Reading Notes and Questions

This week with our focus on time, we read three pieces. Below are some notes, questions and quotes I liked from each.

The Times and the Seasons by John Durham

  • The article says that clocks raise the question “what is to be done” more than calendars. Is that really true?

  • I like the idea that a calendar can suspend time - I had never thought of it that way before. I sometimes feel like this in the very early morning - 4am feels like a suspension of time too.

  • “Why do resources run out on the microscopy and not in its macroscopy?”

  • Water clocks remind me of the fountains that the Incas built at Machu Picchu that still flow today. It makes me wonder - were they designing for this time scale?

  • I had never really considered a time before a second hand and this is making me wonder what my life would be like in that setting

  • Some concepts that stuck with me: 

    • “Sunlight as yet one more commodity subject to the socialist redistribution”

    • “Cruel distortion of human existence”

    • “Mortgage of ourselves to do things we did not actively choose but will not give up”

    • “The challenge with climate change is to make chronos as urgent as kairos”

    • “Clouds transcend geometric and atmospheric logics”

  • I don’t agree that our air is now silent. I hear my the neighborhood church bell often on my way to school or while I’m running. In New York the air is full of the sound of the subway moving according to a daily schedule and birds in the morning during different times of year for example.

  • The tower section reminded me of the towers of Sacsayhuaman, the Inca’s greatest fort that was also one of the main sites of their defeat by the Spanish.

  • I agree that the tower mediates between heaven and earth and a fundamental medium of surveillance but I am still unclear on how it signals between the living and dead and the secular and the sacred.

  • I hadn’t thought before as the weather being constructed by talk, instruments, journalism, but like this framing.

Phenological Mismatch by James Bridle

  • “The greatest trick our utility directed technologies have performed is to constantly pull us out of time” -- I think about this a lot with phone notifications. I have all of mine turned off except for texts and even then usually keep my phone on silent. I am always surprised when people get push notifications from all of their apps - it is so completely overwhelming and jarring to me.

  • “We thought technology was about means, but it has been subverted for ends.”

  • The ends cannot justify the means because “the means employed determine the ends produced” - I have never quite heard this argument phrased this way and I find it helpful and compelling.

  • I love the Tamagotchi reference and vividly remember seeing behavior of my friends in 2nd grade change when they got one - suddenly they were controlled by/attending to this other thing I didn’t understand but it made me want one.

  • I often think about the energy consumption of my computer when I am developing VR projects - my computer heats up, it makes noise and pretty much can’t run without being plugged in. I haven’t yet dug into the ethics of working on projects like these, but it is something I think we need to address at a place like ITP or IDM because we don’t often make the connection to a bigger system.

  • Pervasive technology terms:

    • “Computers can be proactively persistent”

    • “Novelty of technology can mask its pervasive intent”

  • I am currently doing research on the history of the development of the internet and I can’t help but thinking that some of these problems could be addressed by going back to some of the earlier ways of thinking about this particular technology and approaches that have since been lost. The question I have been asking myself over and over again in this research is: What would a feminist internet look like?

Exhalation by Ted Chiang

  • I like and think that it is significant that everything in this story is mechanical - it allows a level of abstraction and removal from our current technologies that gives us a step back when thinking about the analogy.

  • Is this story explicit in response to CO2 levels rising and causing a decline in cognitive ability or more generally?

  • Do these creatures feel pain?

  • Quotes that stuck with me:

    • “Air is the medium of our thoughts”

    • “The price of speed”

    • “Then time itself will cease”

    • “With every movement contributes to fatal equilibrium”

  • Coming from a background of economics, this story had a satisfying ending because equilibrium is the state the whole field is trying to achieve. It makes me think again of a quote from the first reading about weather: “the privilege of being ordinary” (to me, this is the definition of privilege). This has never seemed to me like a natural state, which was also learned in the reaction to cybernetics. 

  • Going back to the last quote - “then time itself will cease” - I wonder if this something economists overlook in their models, that what marks time is the movement back, in and out of equilibrium and trying to get back to equilibrium.


Measuring Device: Rain Garden

This measuring device is designed to be used by a Garden Stewards to collect data on NYC Rain Gardens and post the data on the site, opening up a new relationship between the public, data and infrastructure.

P3590161.JPG

Concept

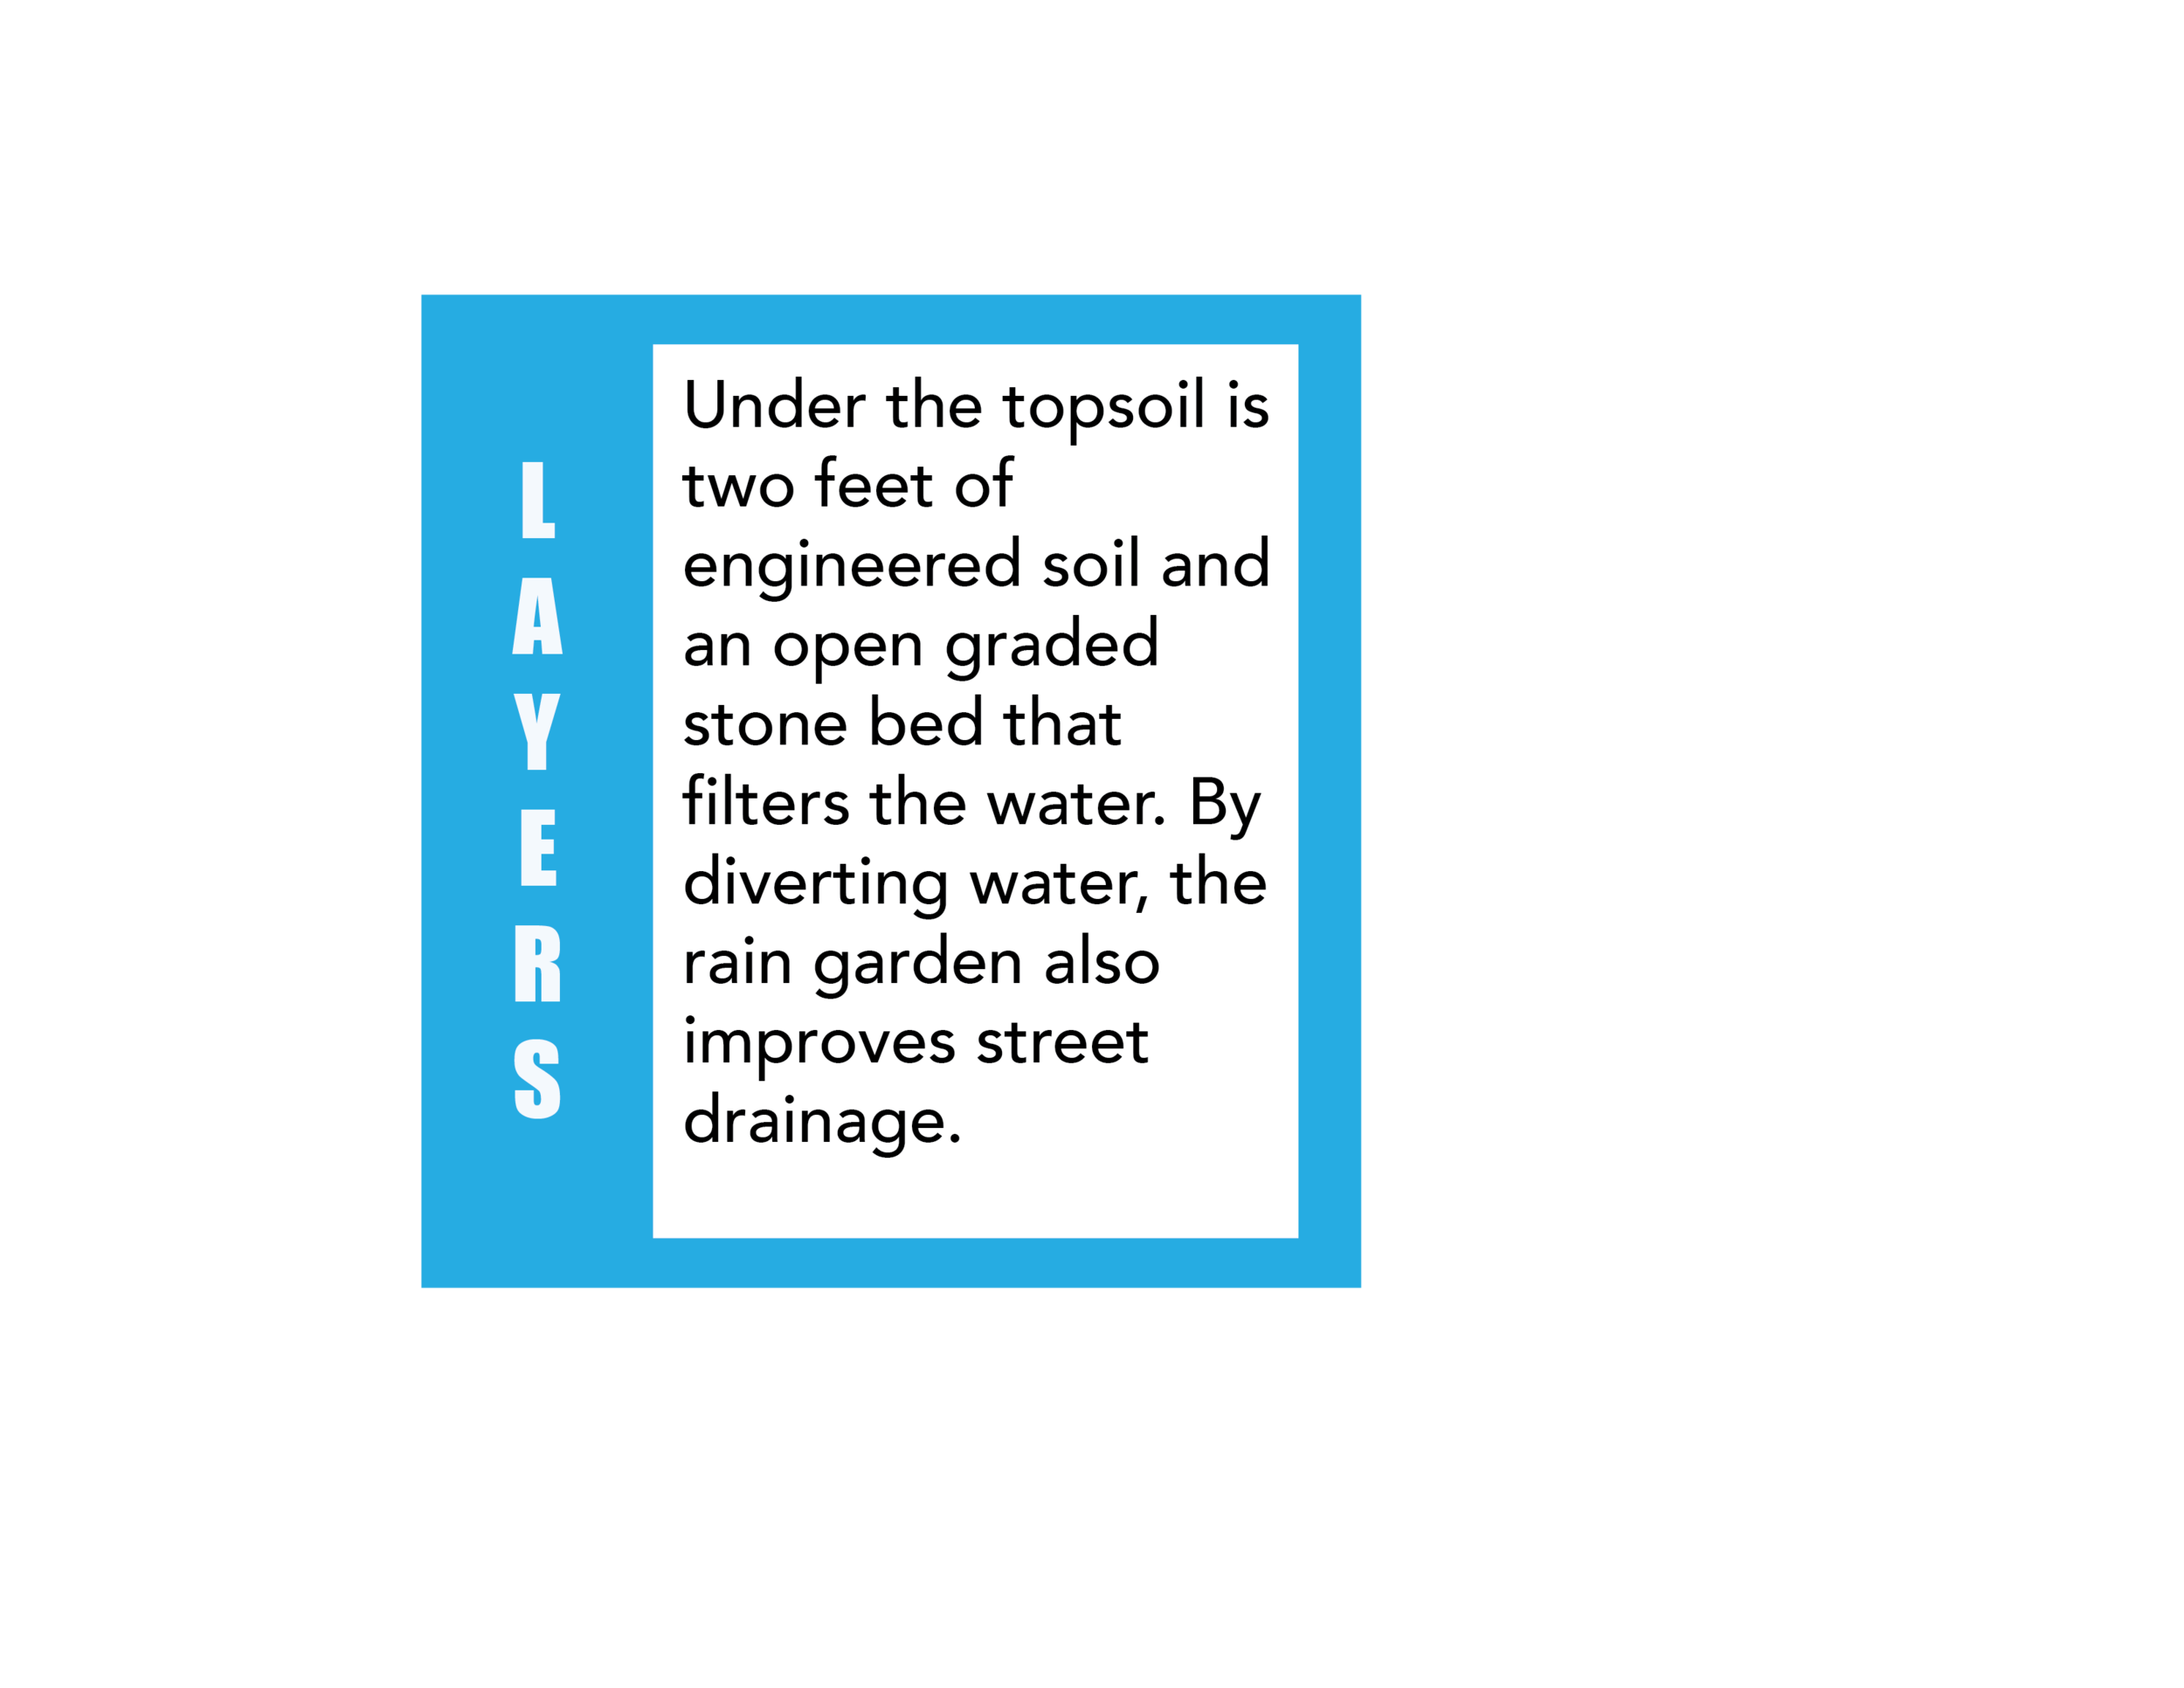
Rain Gardens (bioswales) are a form of green infrastructure built to improve street drainage, sewer system overflow and water quality in New York City waterways. They require extensive engineering to build and are actively maintained by the city and volunteer Garden Stewards. Anyone can apply to be a Garden Steward, and depending on the volunteer’s experience, the City provides training on how to perform simple maintenance a few times a month, carry out sediment removal and weeding, and organizing planting events.

What is striking about Rain Gardens is that they invisible infrastructure. Underneath their surface are imperceptible flows, a living spongy world made of dirt, rocks, gravel doing hidden work as part of a larger water ecosystem. One of the goals of the project is to unearth and bring to the surface what is underground. I have primarily done this by applying the ideas from Spongiform, an article by anthropologist Andrea Ballestero, to the NYC rain gardens context.

Like Ballestero’s aquifers, the presence of the rain garden fuzzes the the boundary between our lives and the NYC waterways. By acting as a permeable layer with multi-dimensional movement and flows, it destabilizes our conceptual model of the solid water system made of concrete, gutters and pipes.

In this project I ask: how could this device...

  1. Expand the boundary around citizenship to include maintenance of systems?

  2. Make inputs and outputs explicit in order to re-draw the boundary of the Rain Garden?

This project addresses these questions by making the rain garden data part of the visible aspects of the infrastructure. How does this type of intervention adjust our volumetric understandings of what is below our feet and how we are connected to New York City water ecosystem? My hope is that this project prompts the passerby to acknowledge that both they and the rain garden are actors in the same system.


Device

In the context of the larger water system, I wanted to make the passerby connect the dots between the different actors and blur their previously conceived boundaries in order to reconfigure the Rain Garden data in a meaningful way. The rain garden data is normally separate from the physical garden, usually located in an open data portal or report produced by the city. This project aims to make it part of the Rain Garden form itself. This project asks: in what ways is the rain garden a manifestation of the data? In what ways is the data a manifestation of the rain garden?

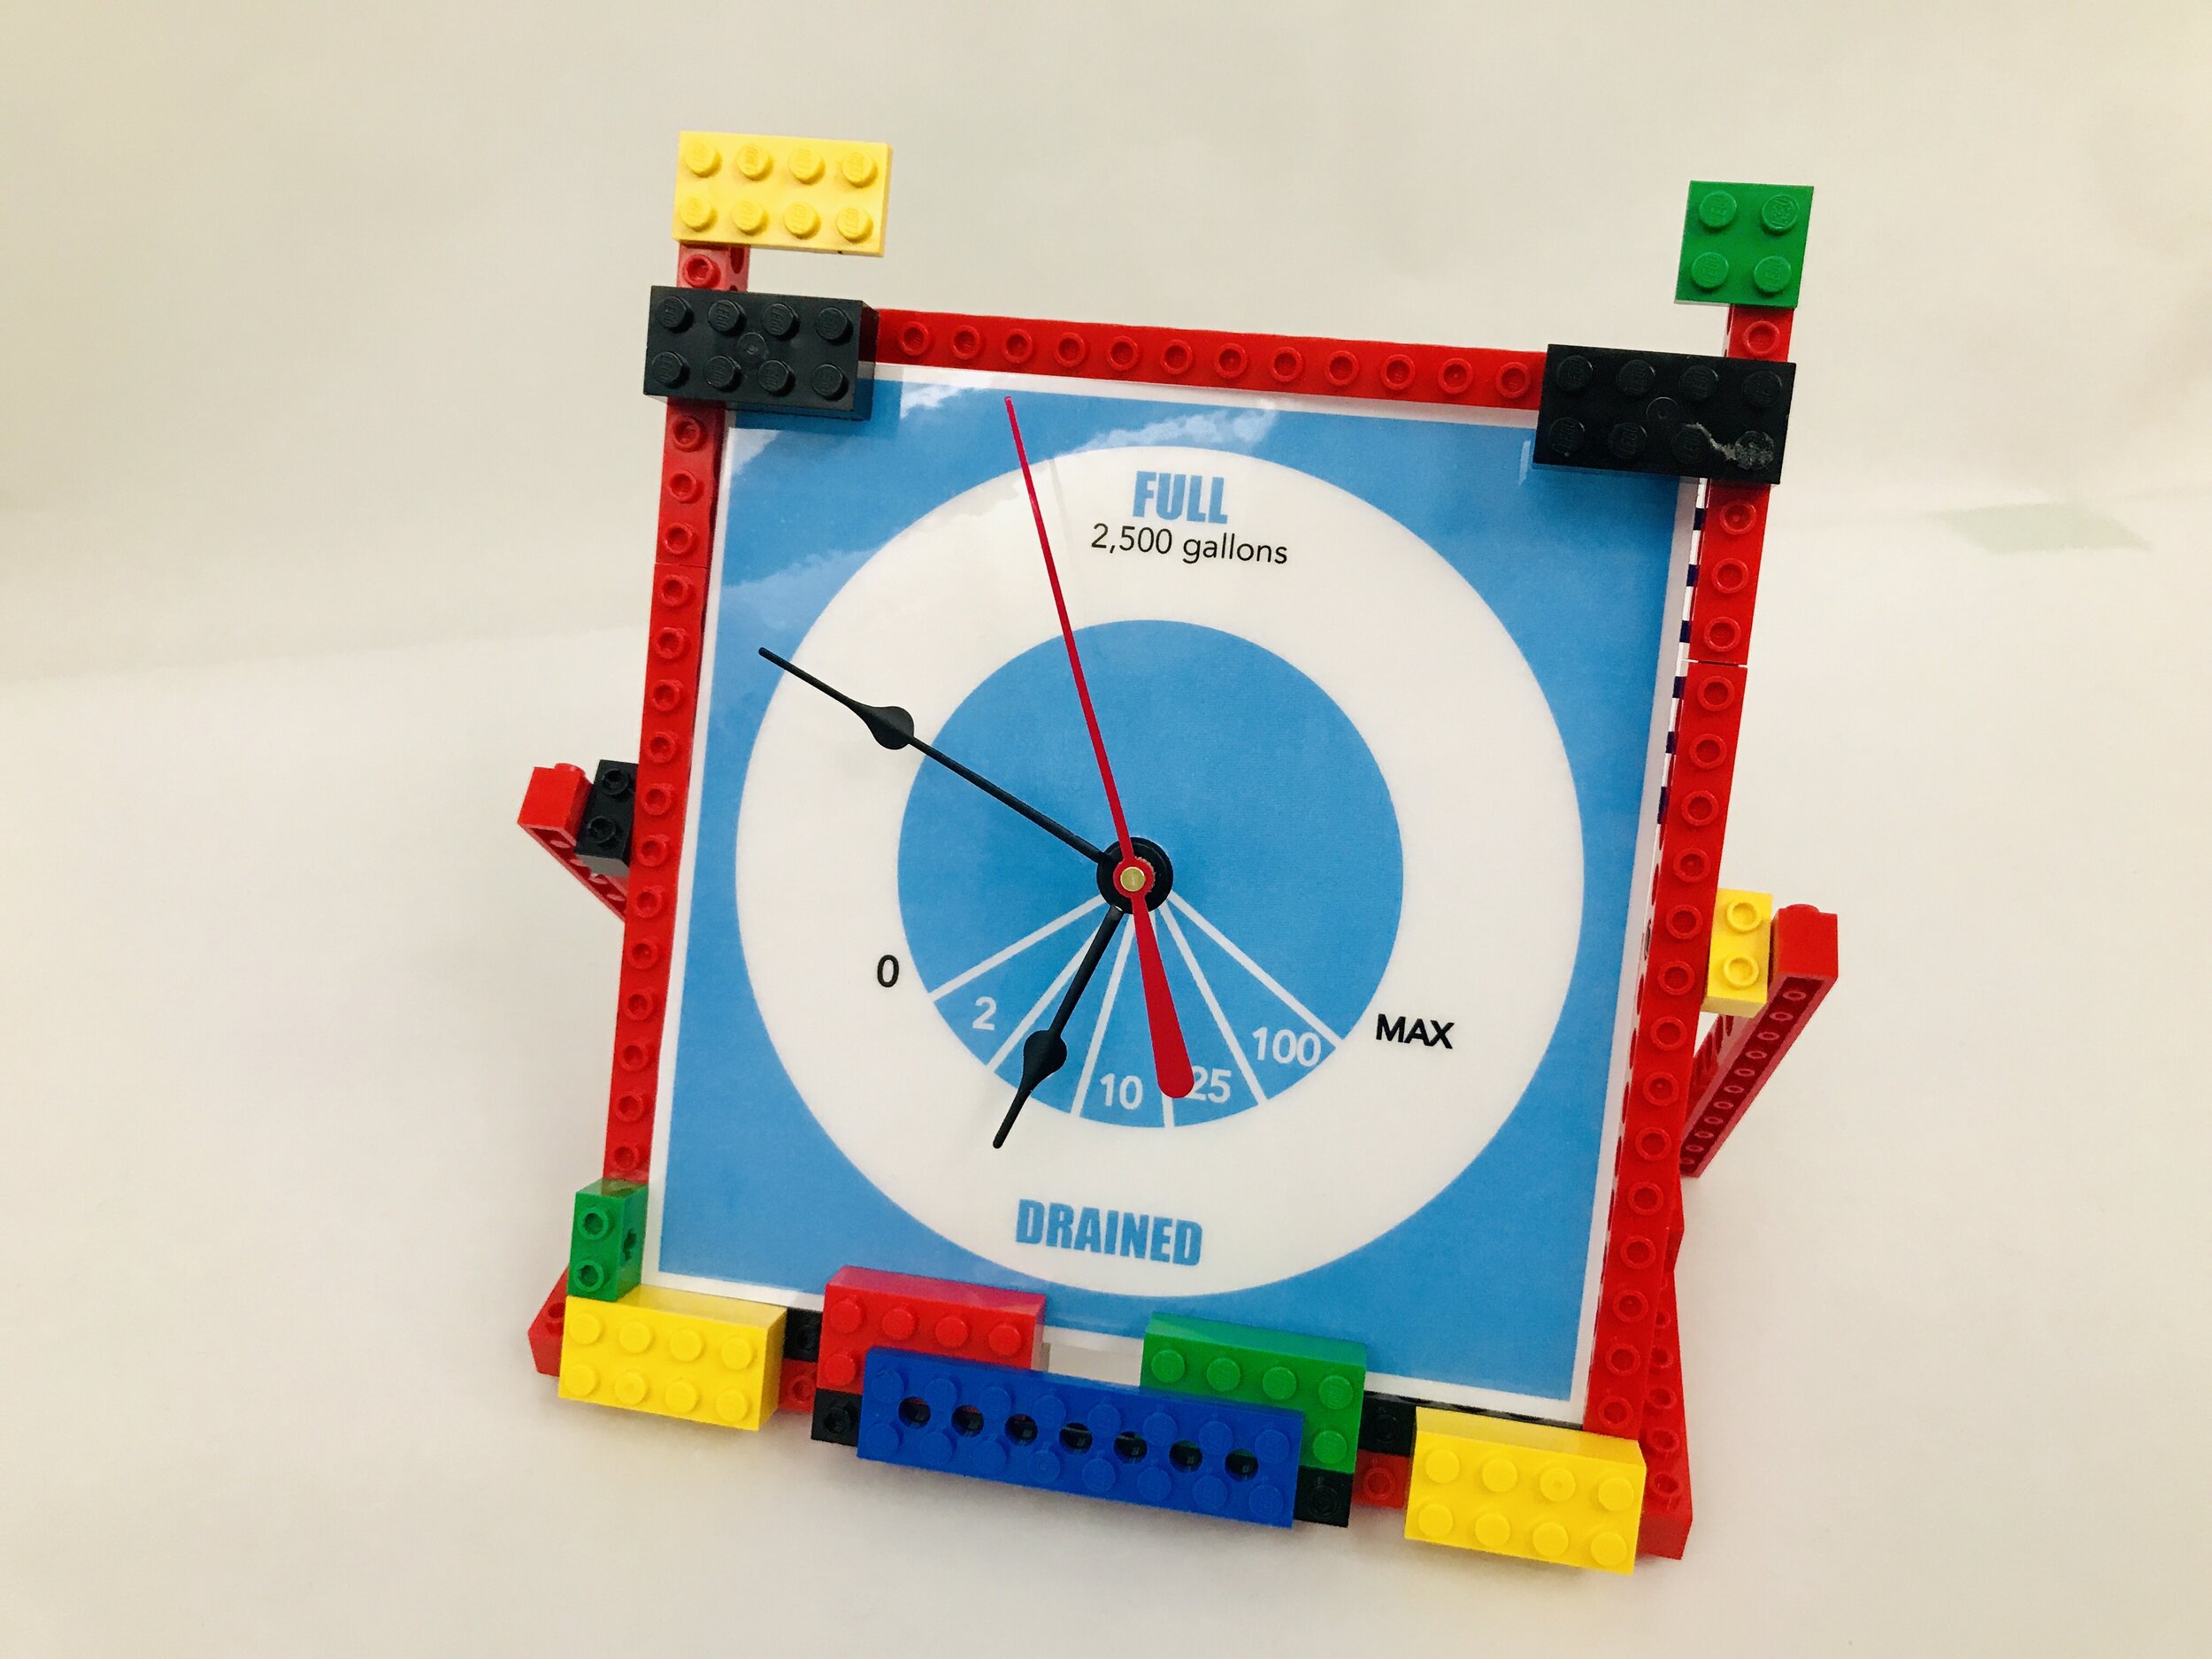
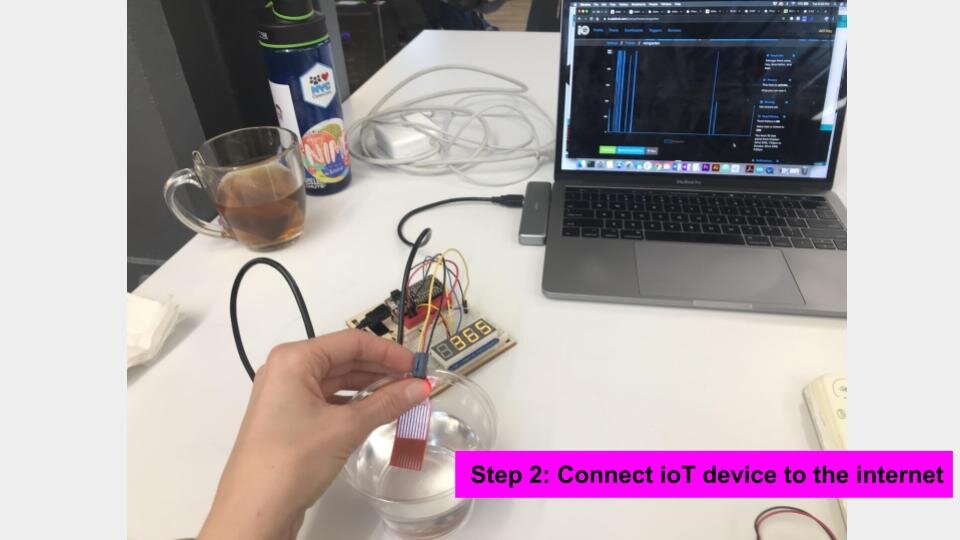
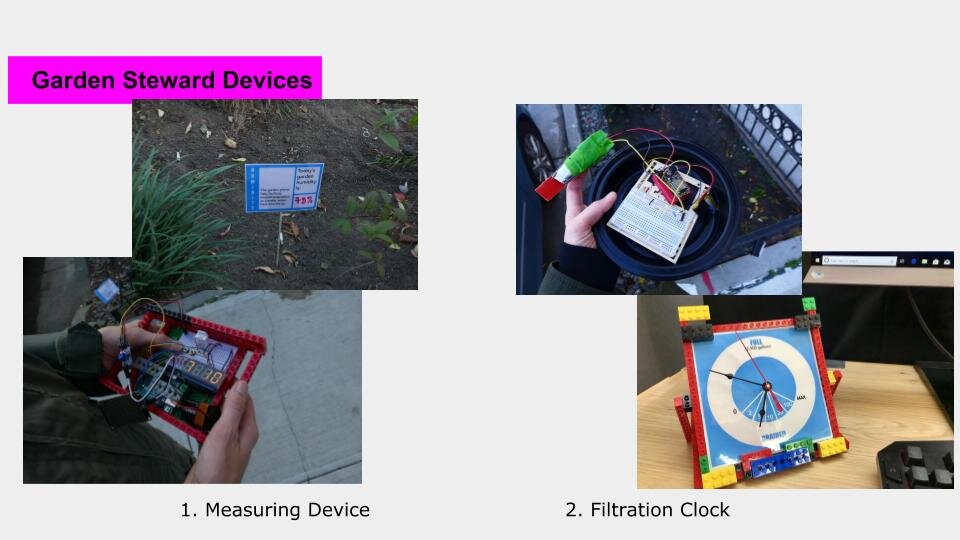
The device uses two sensors: 1) a moisture sensor and 2) a humidity and temperature sensor connected to an Arduino that takes the data and displays it on a mini LCD screen when the corresponding buttons are pressed.

P3590172.JPG

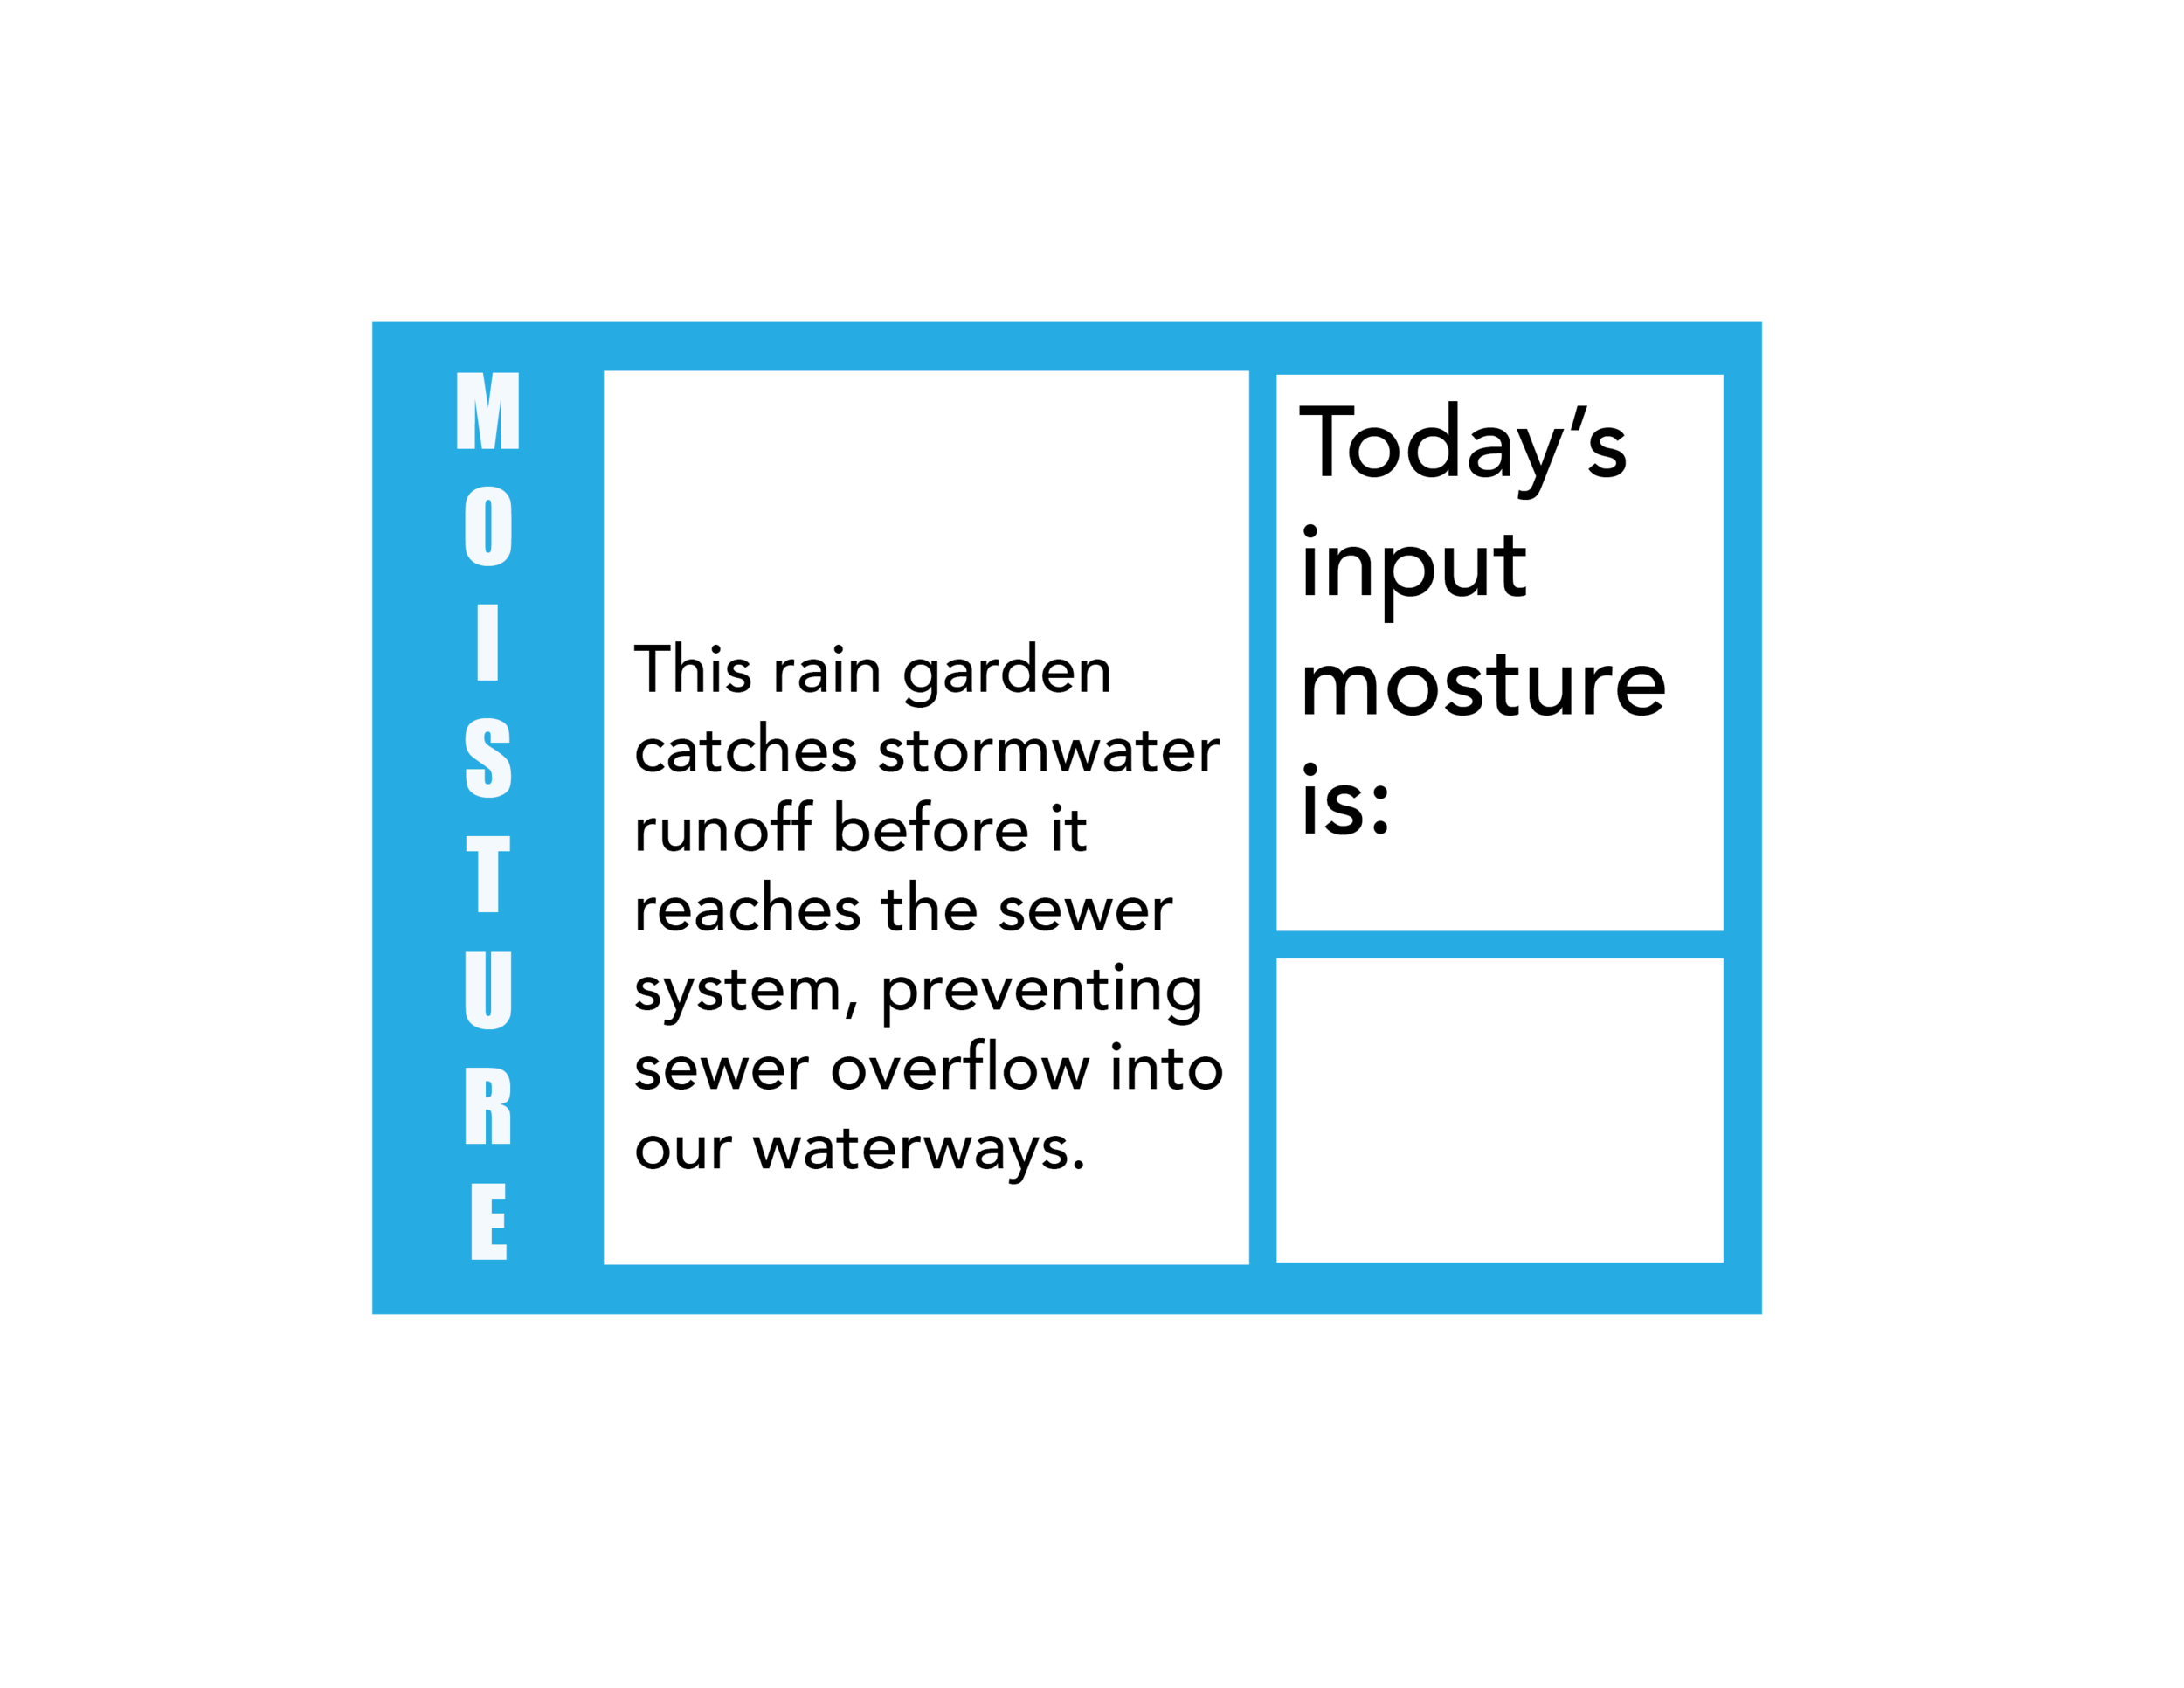
The garden steward uses this device to display the data points on the rain garden signs that explain how the rain garden works:

P3590173.JPG

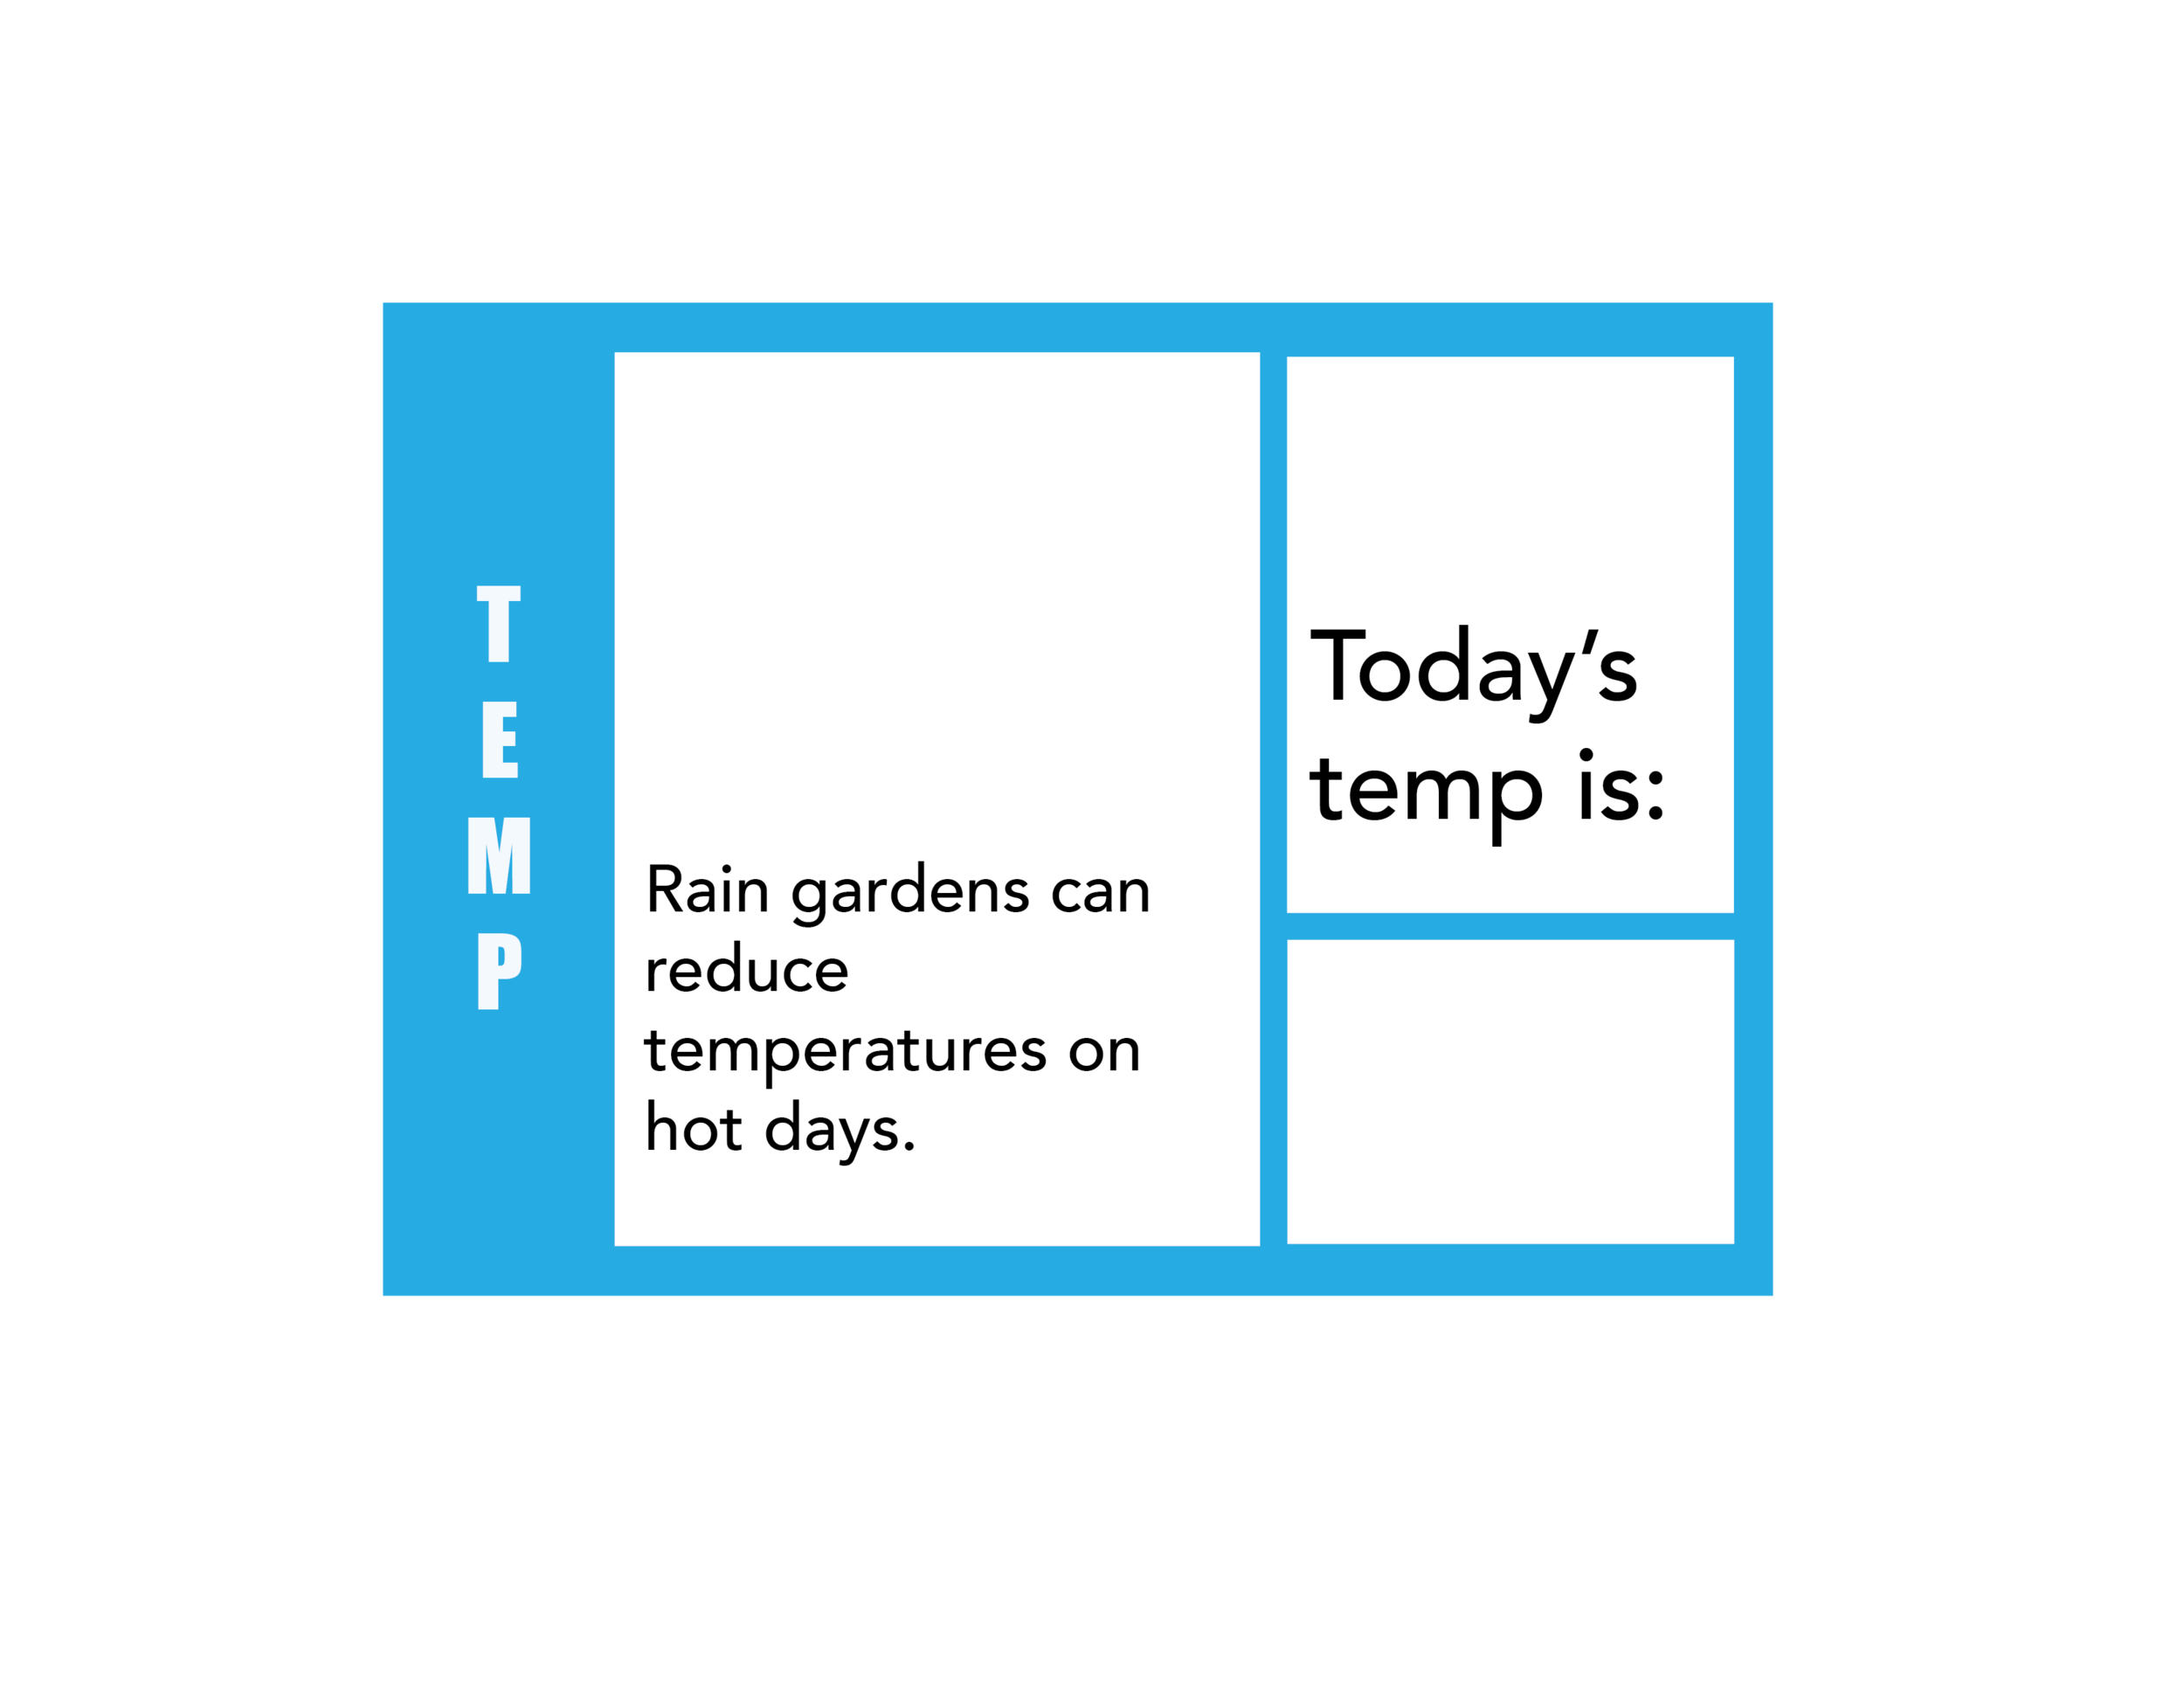
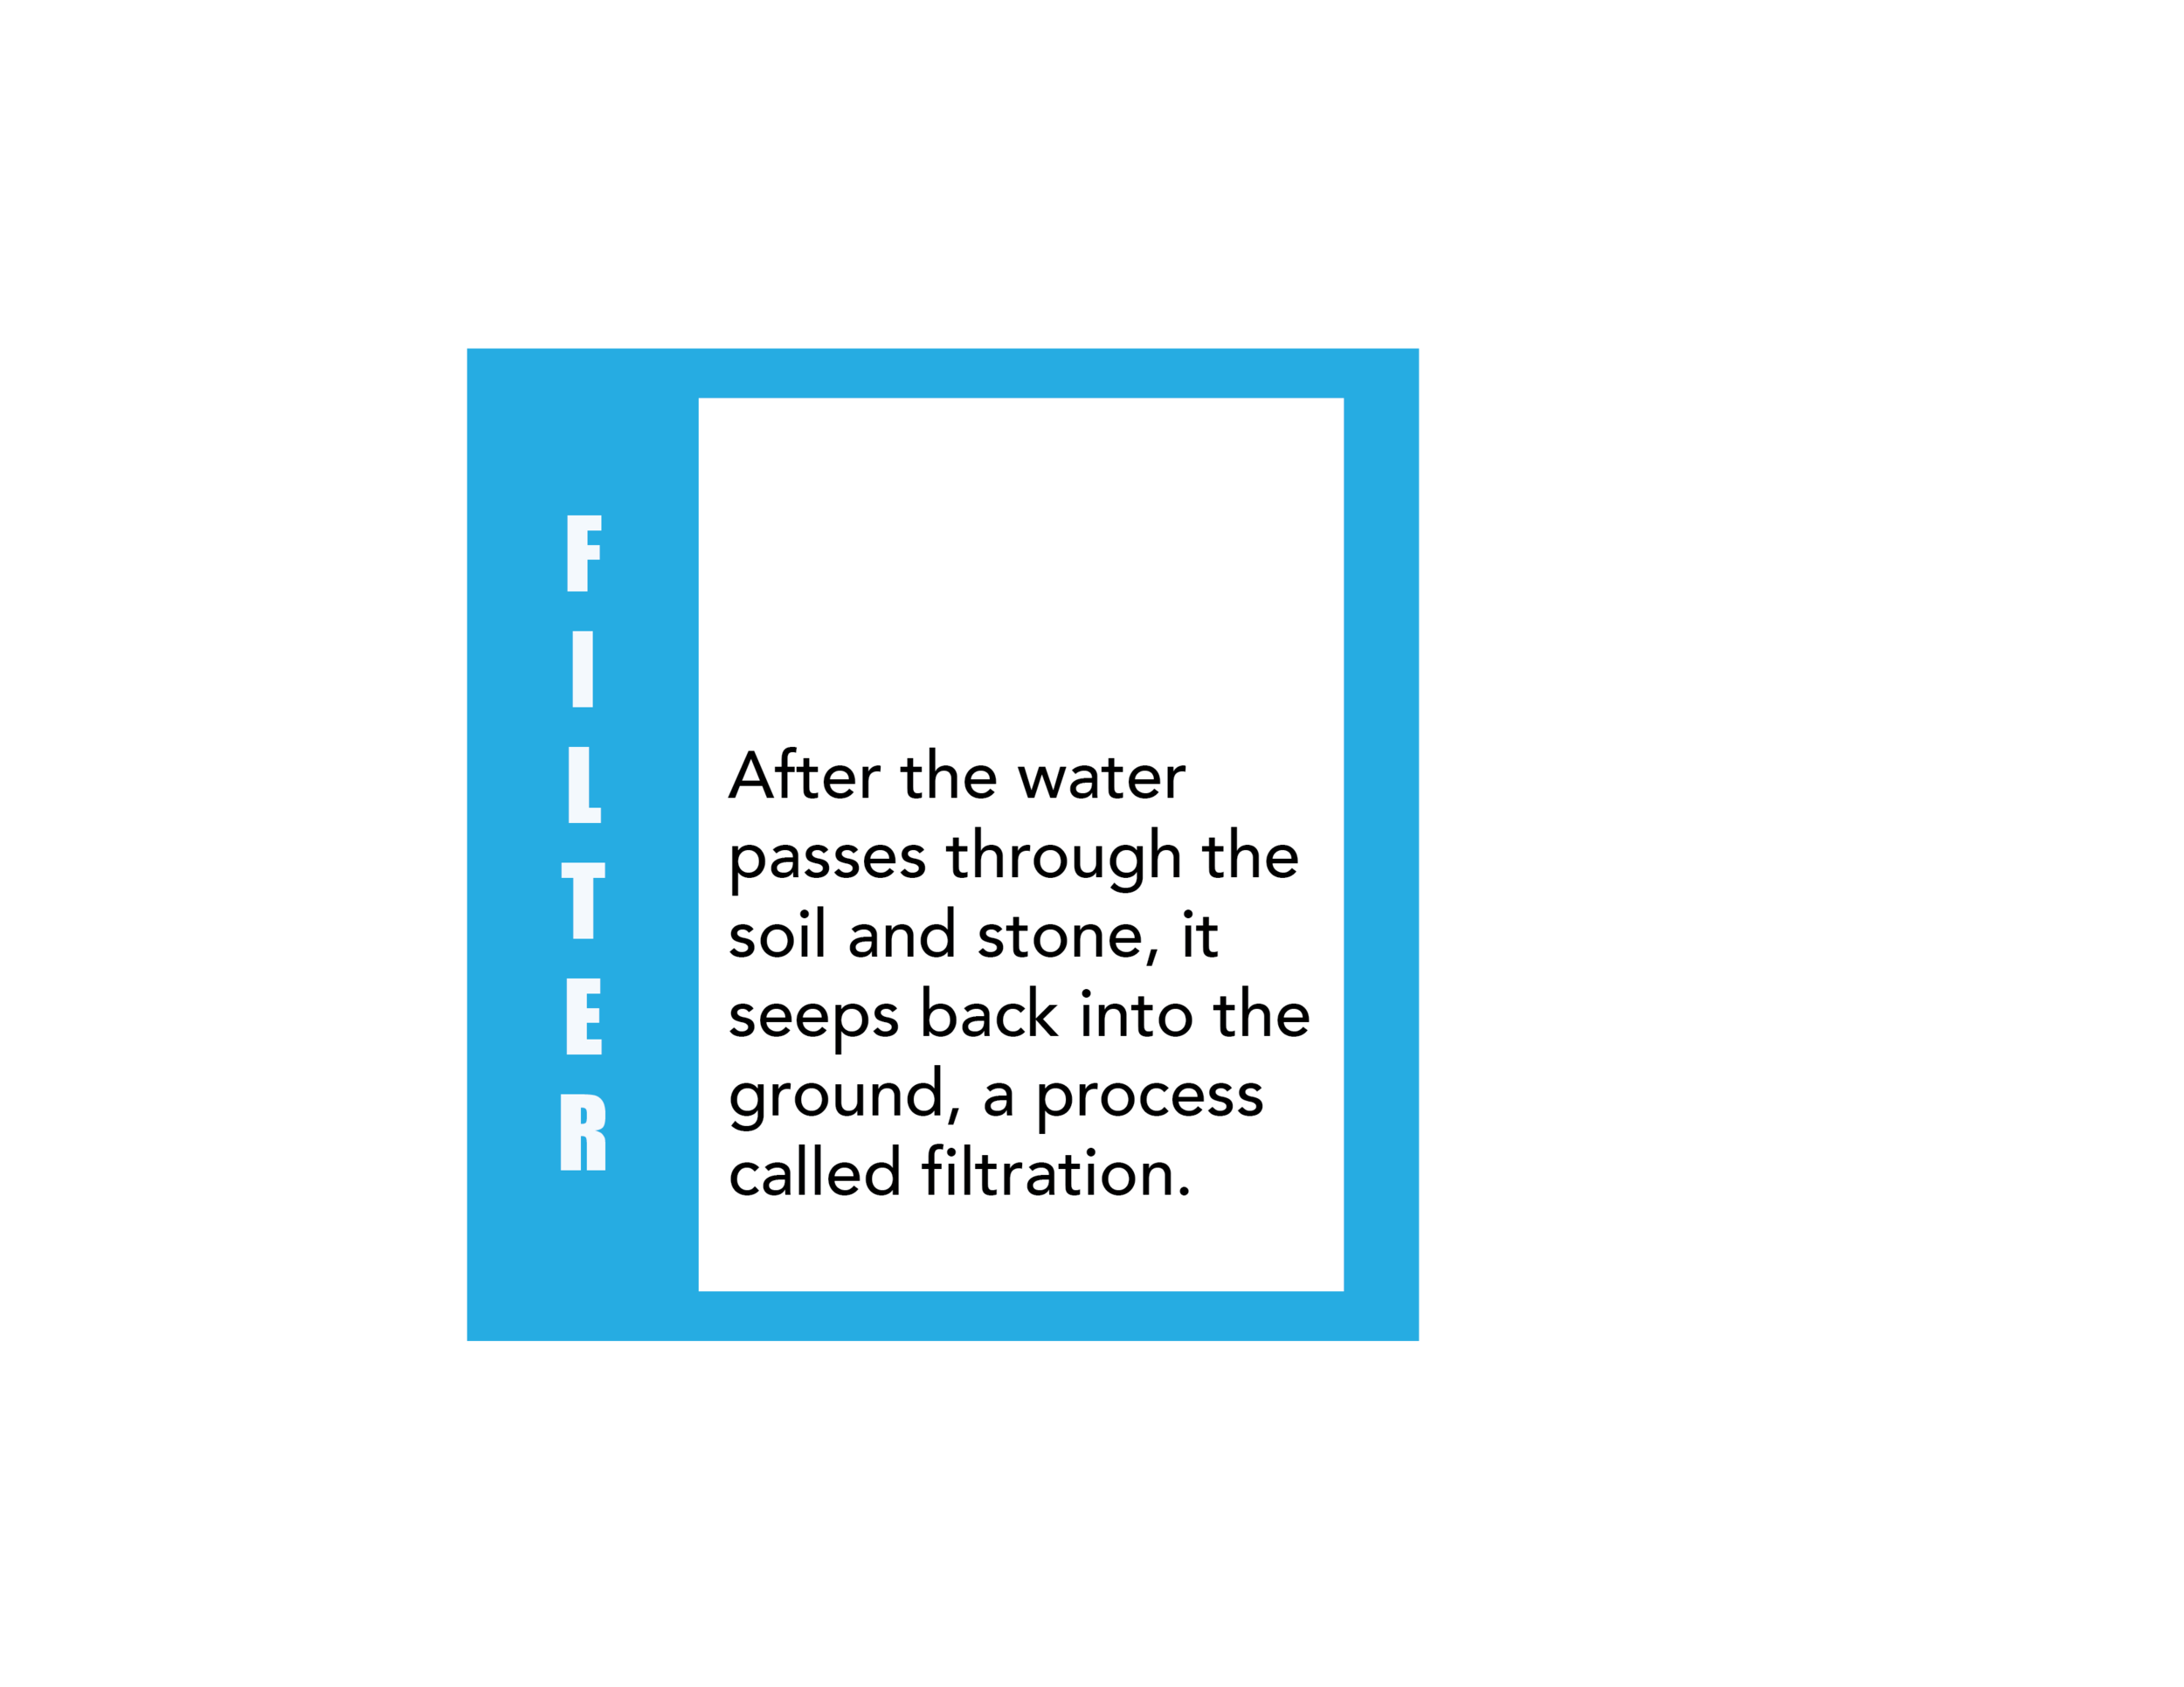
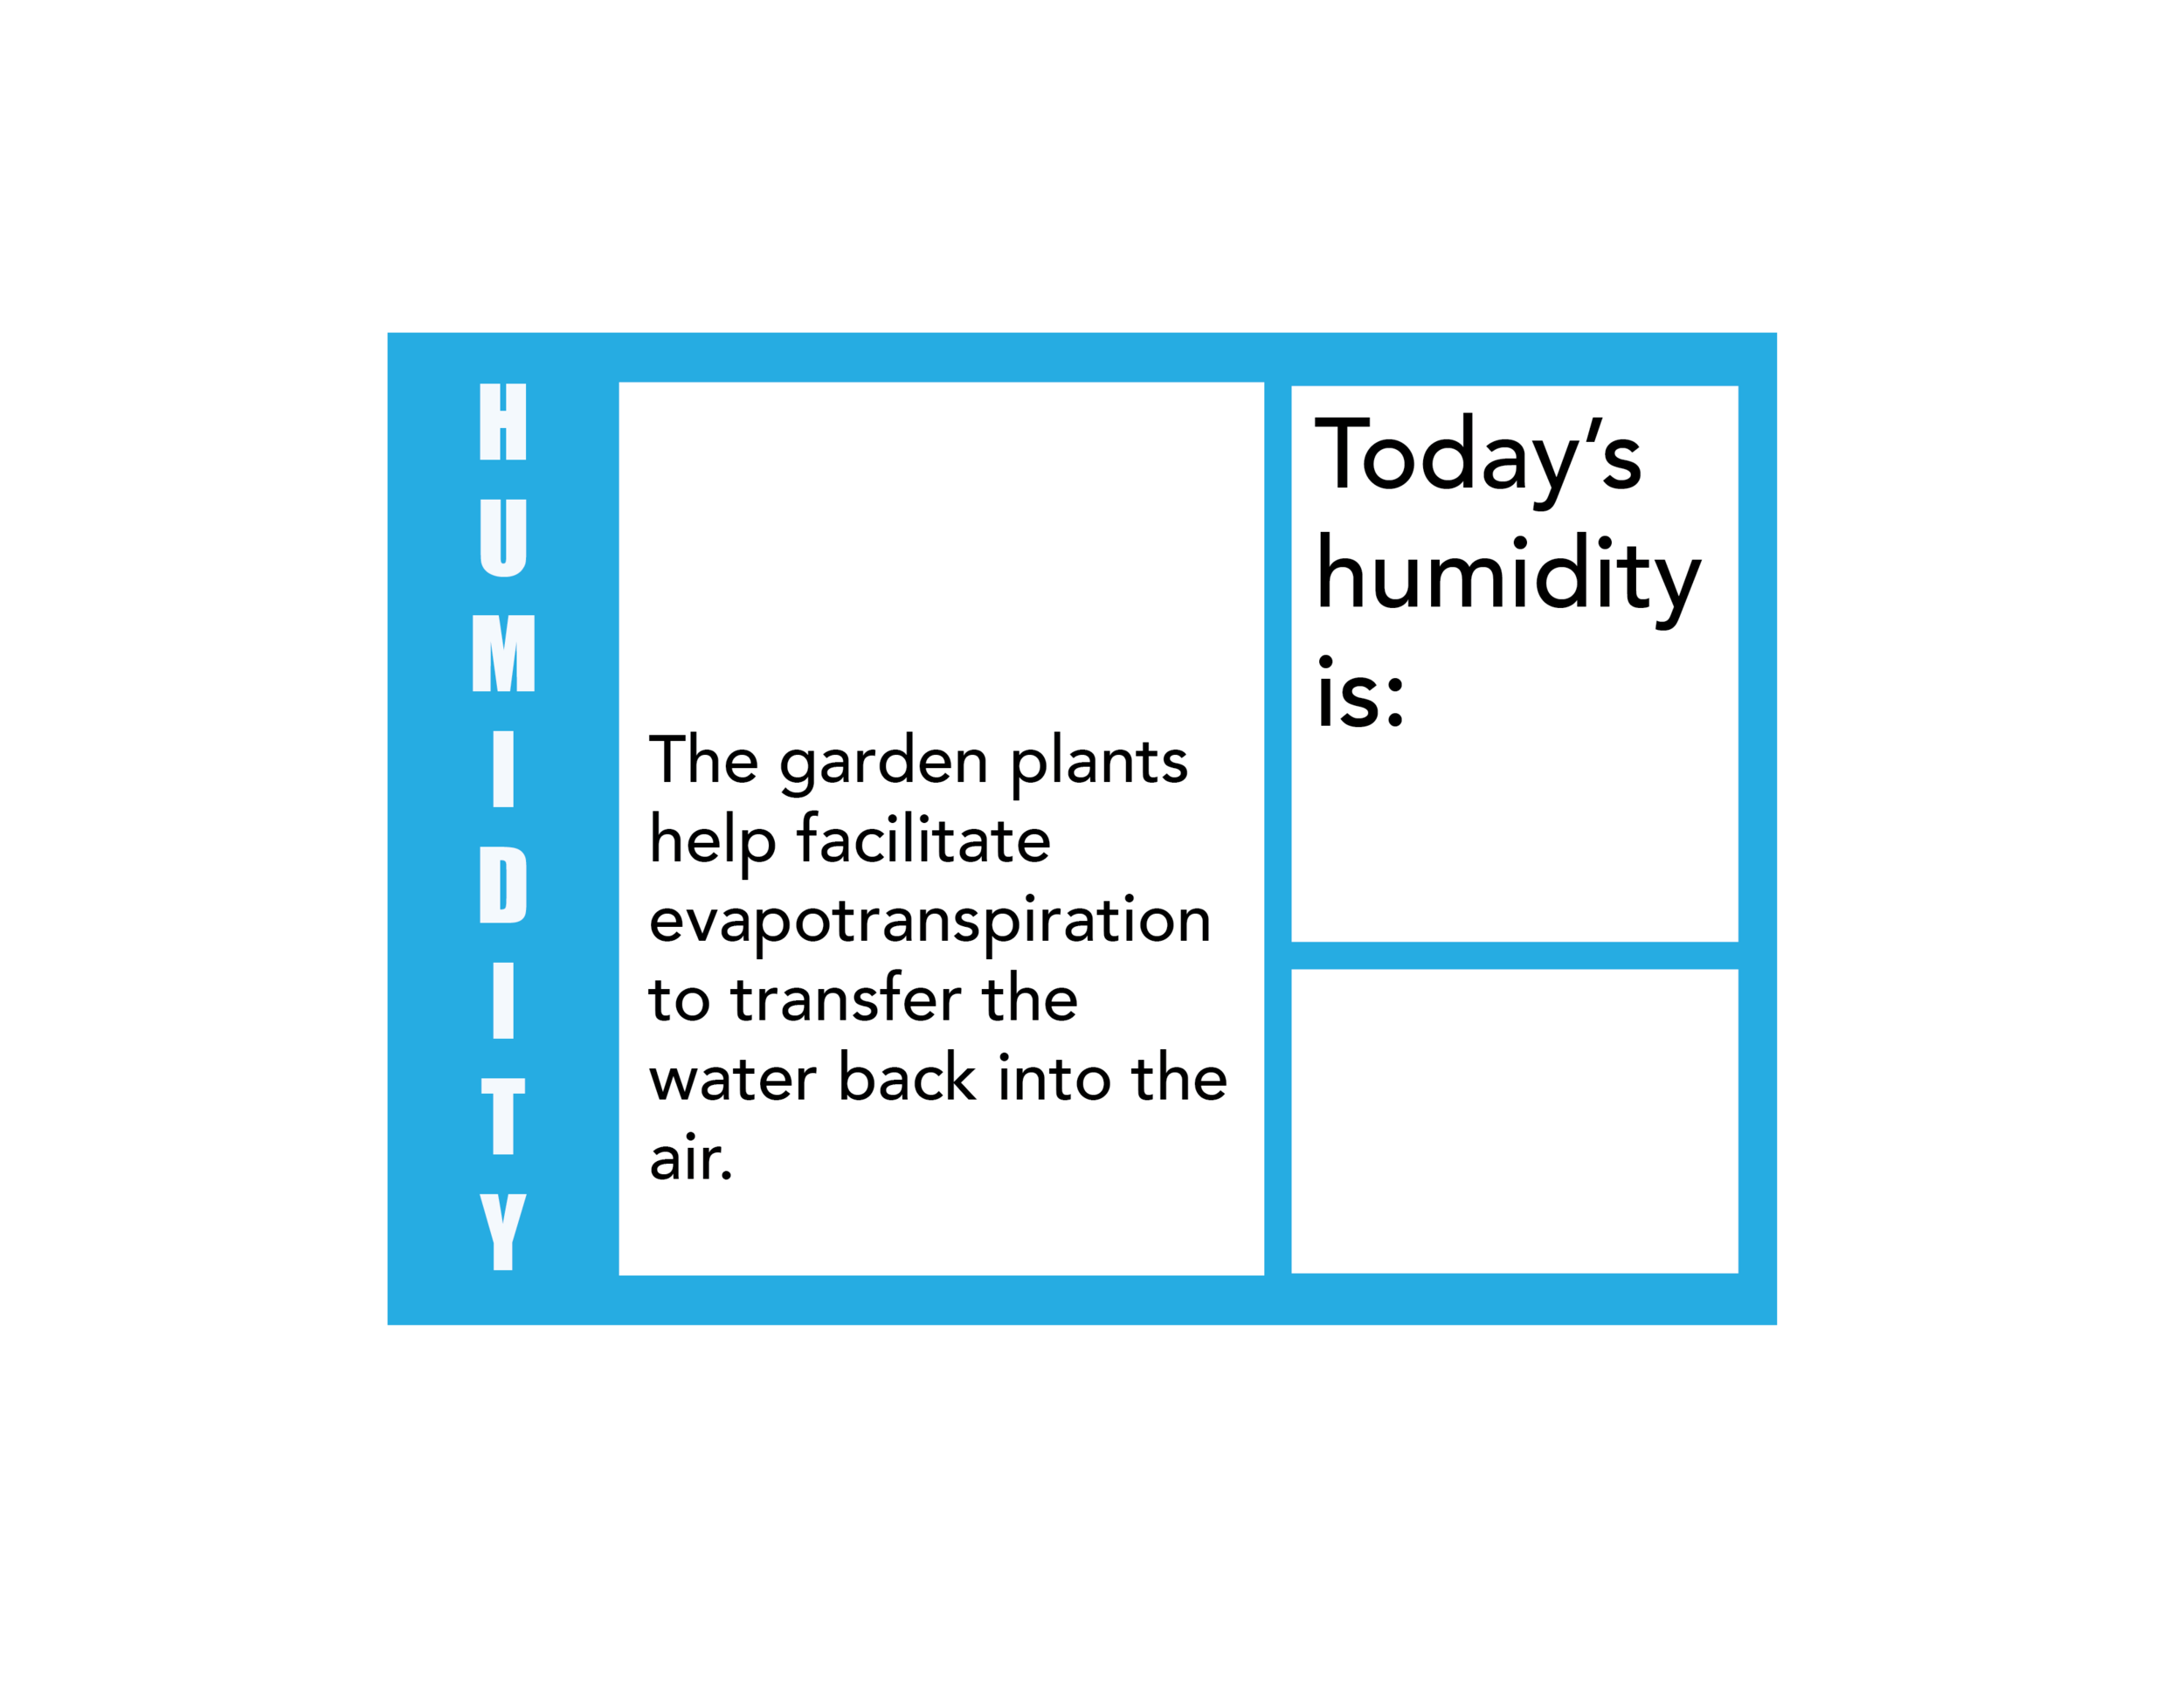
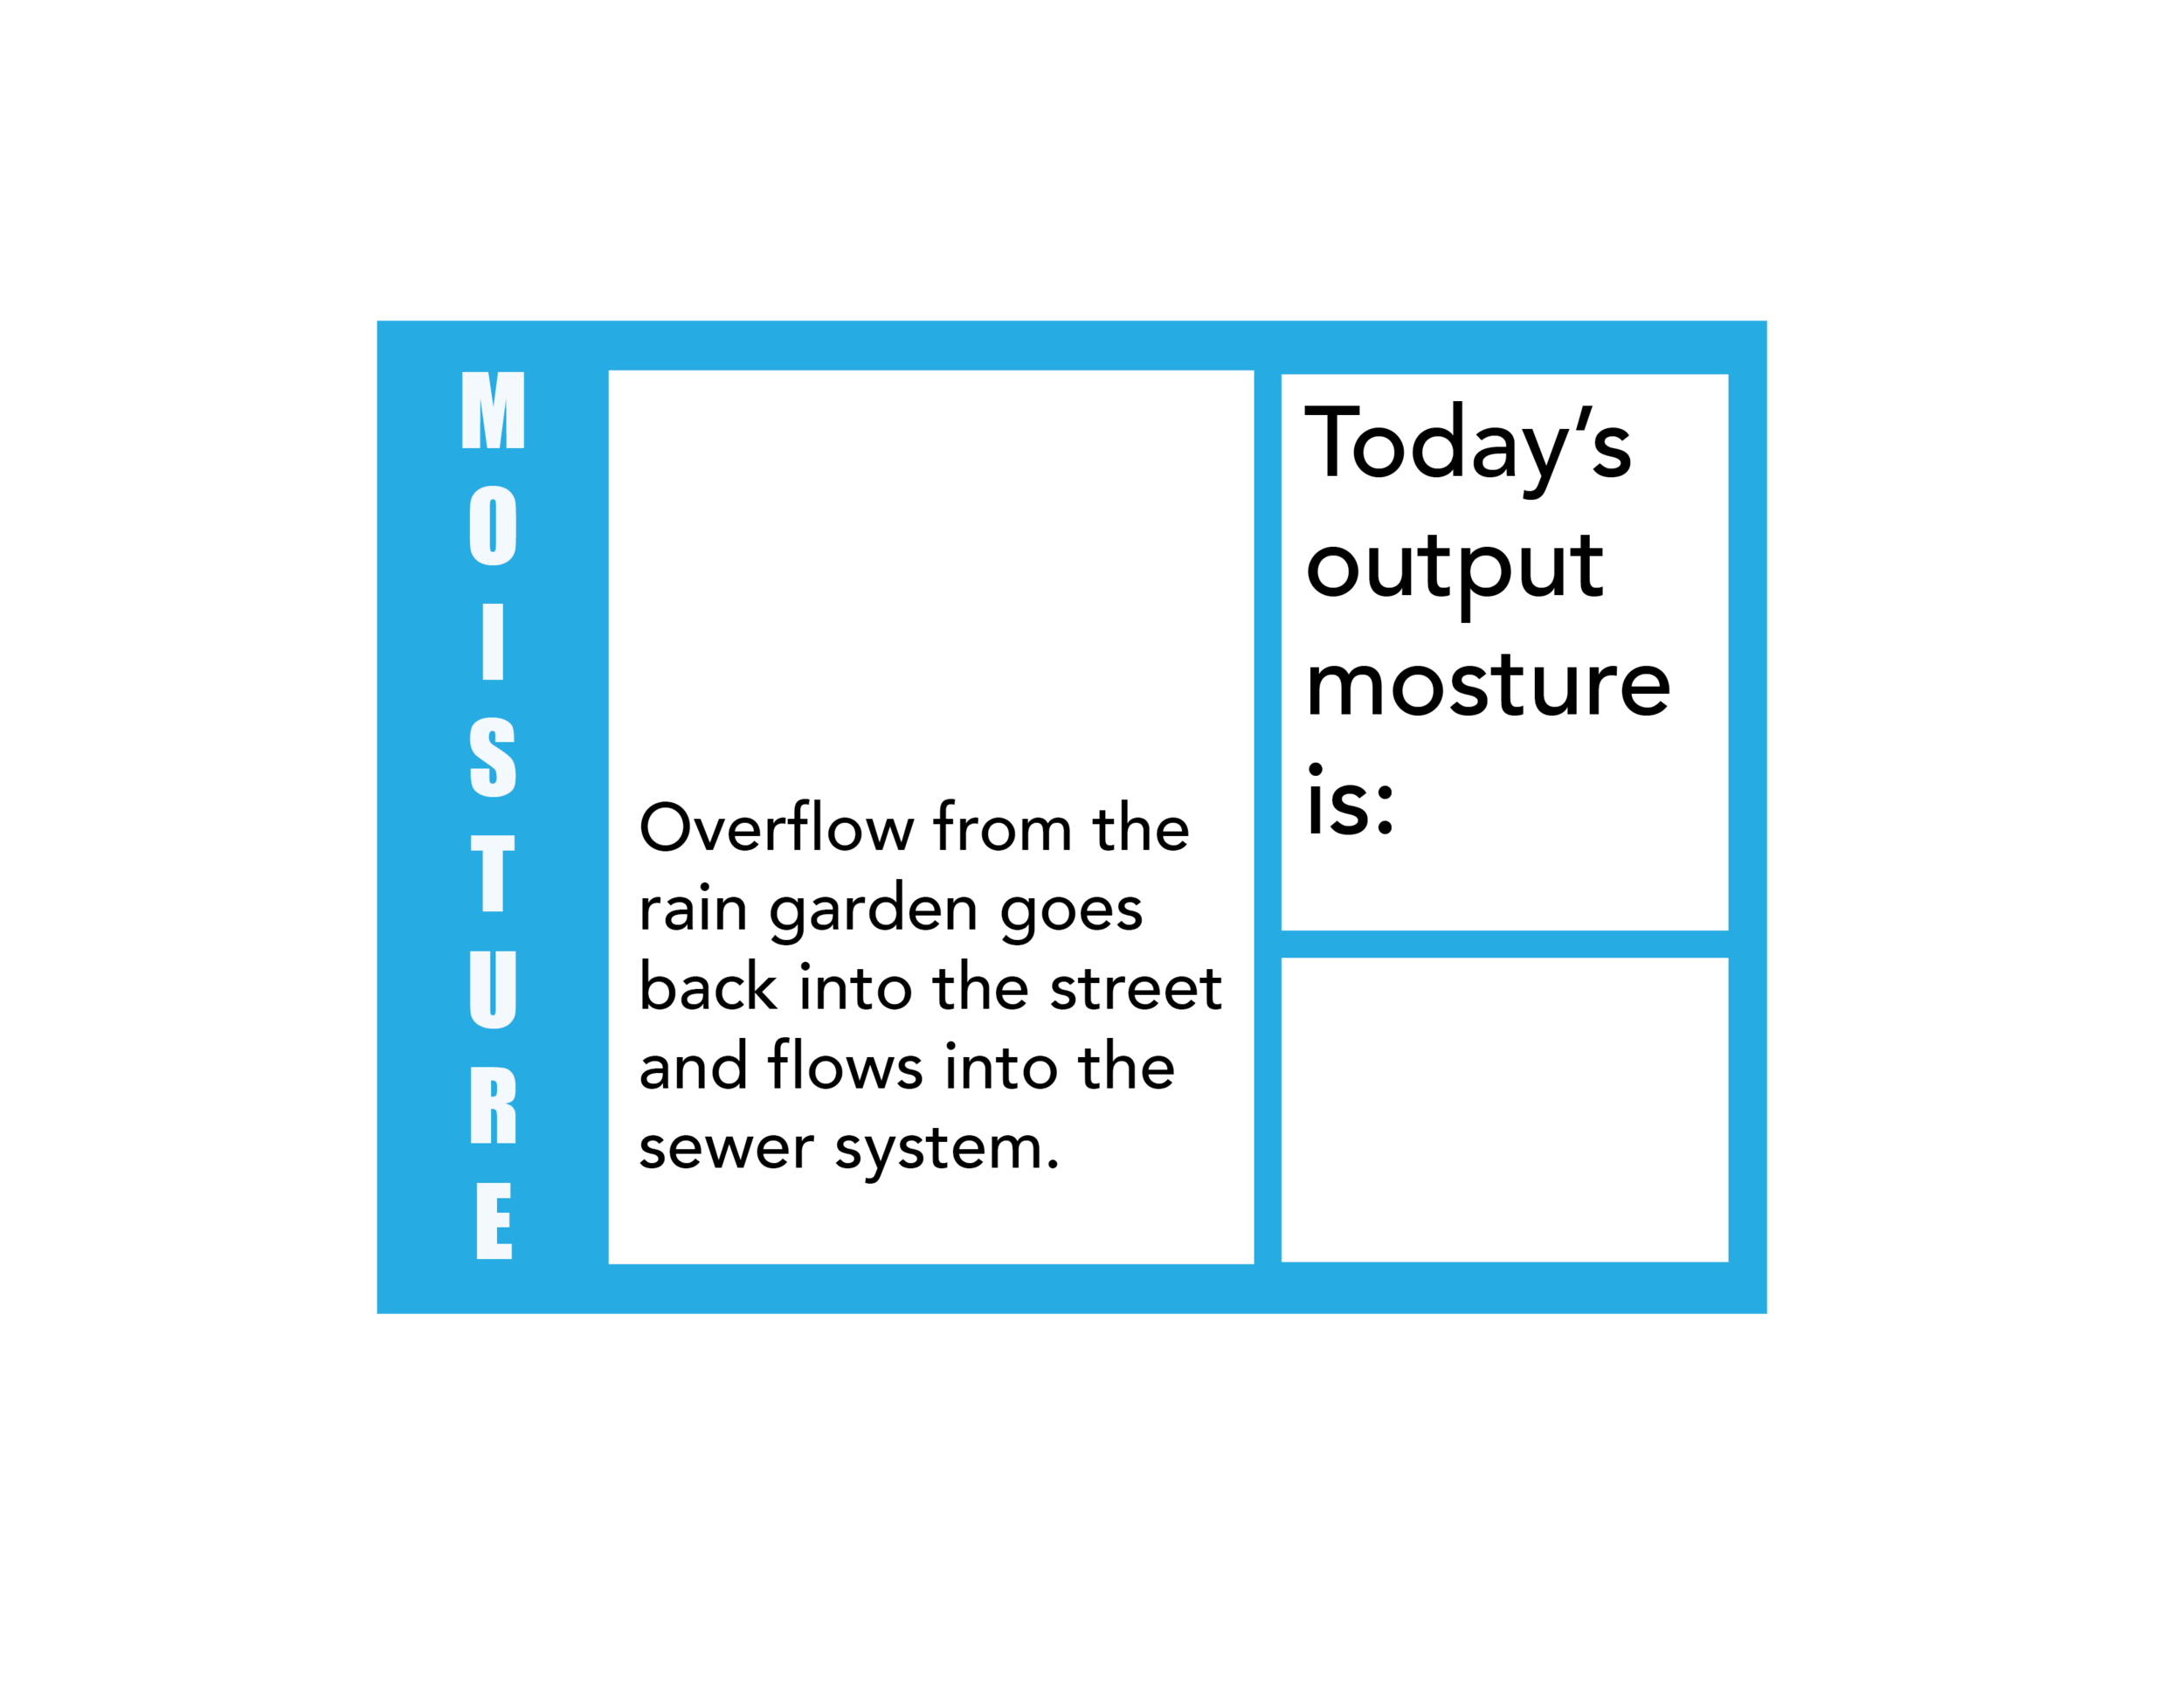
There are six signs in total with three different measurements:

Process

rain_garden_boundary.JPG

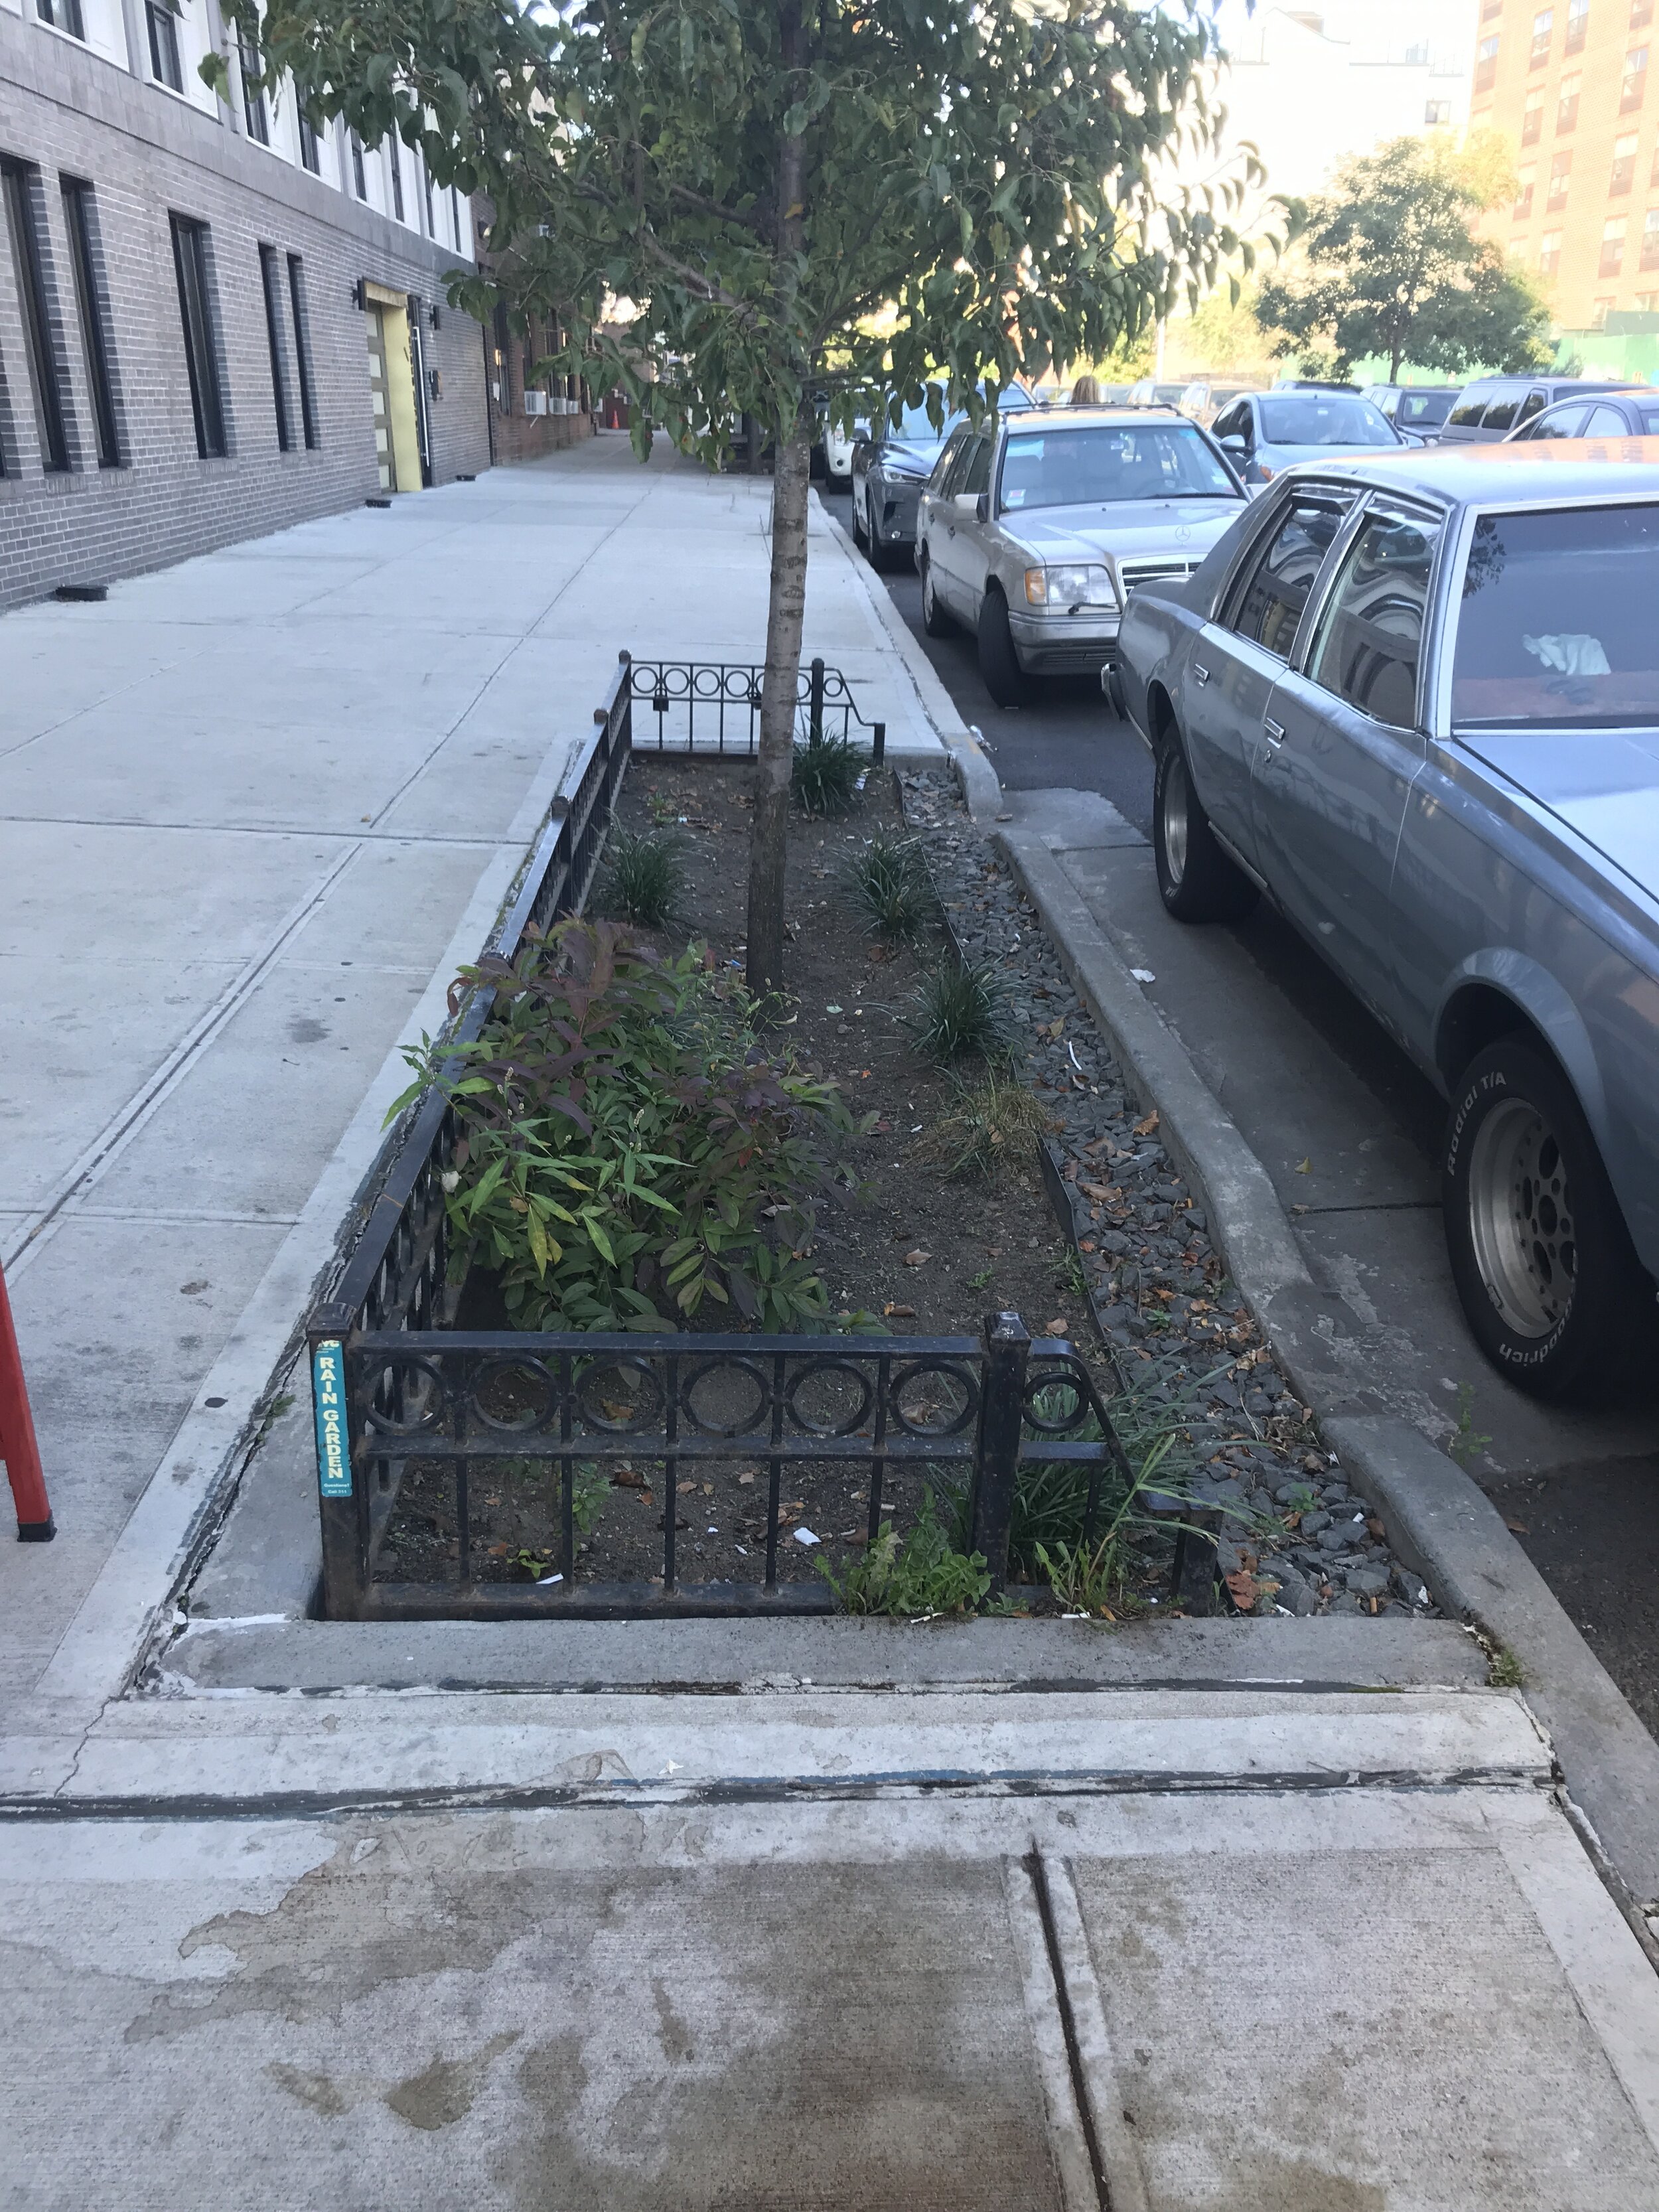
To design this collection and display of information, I started by drawing the boundary of my rain garden.


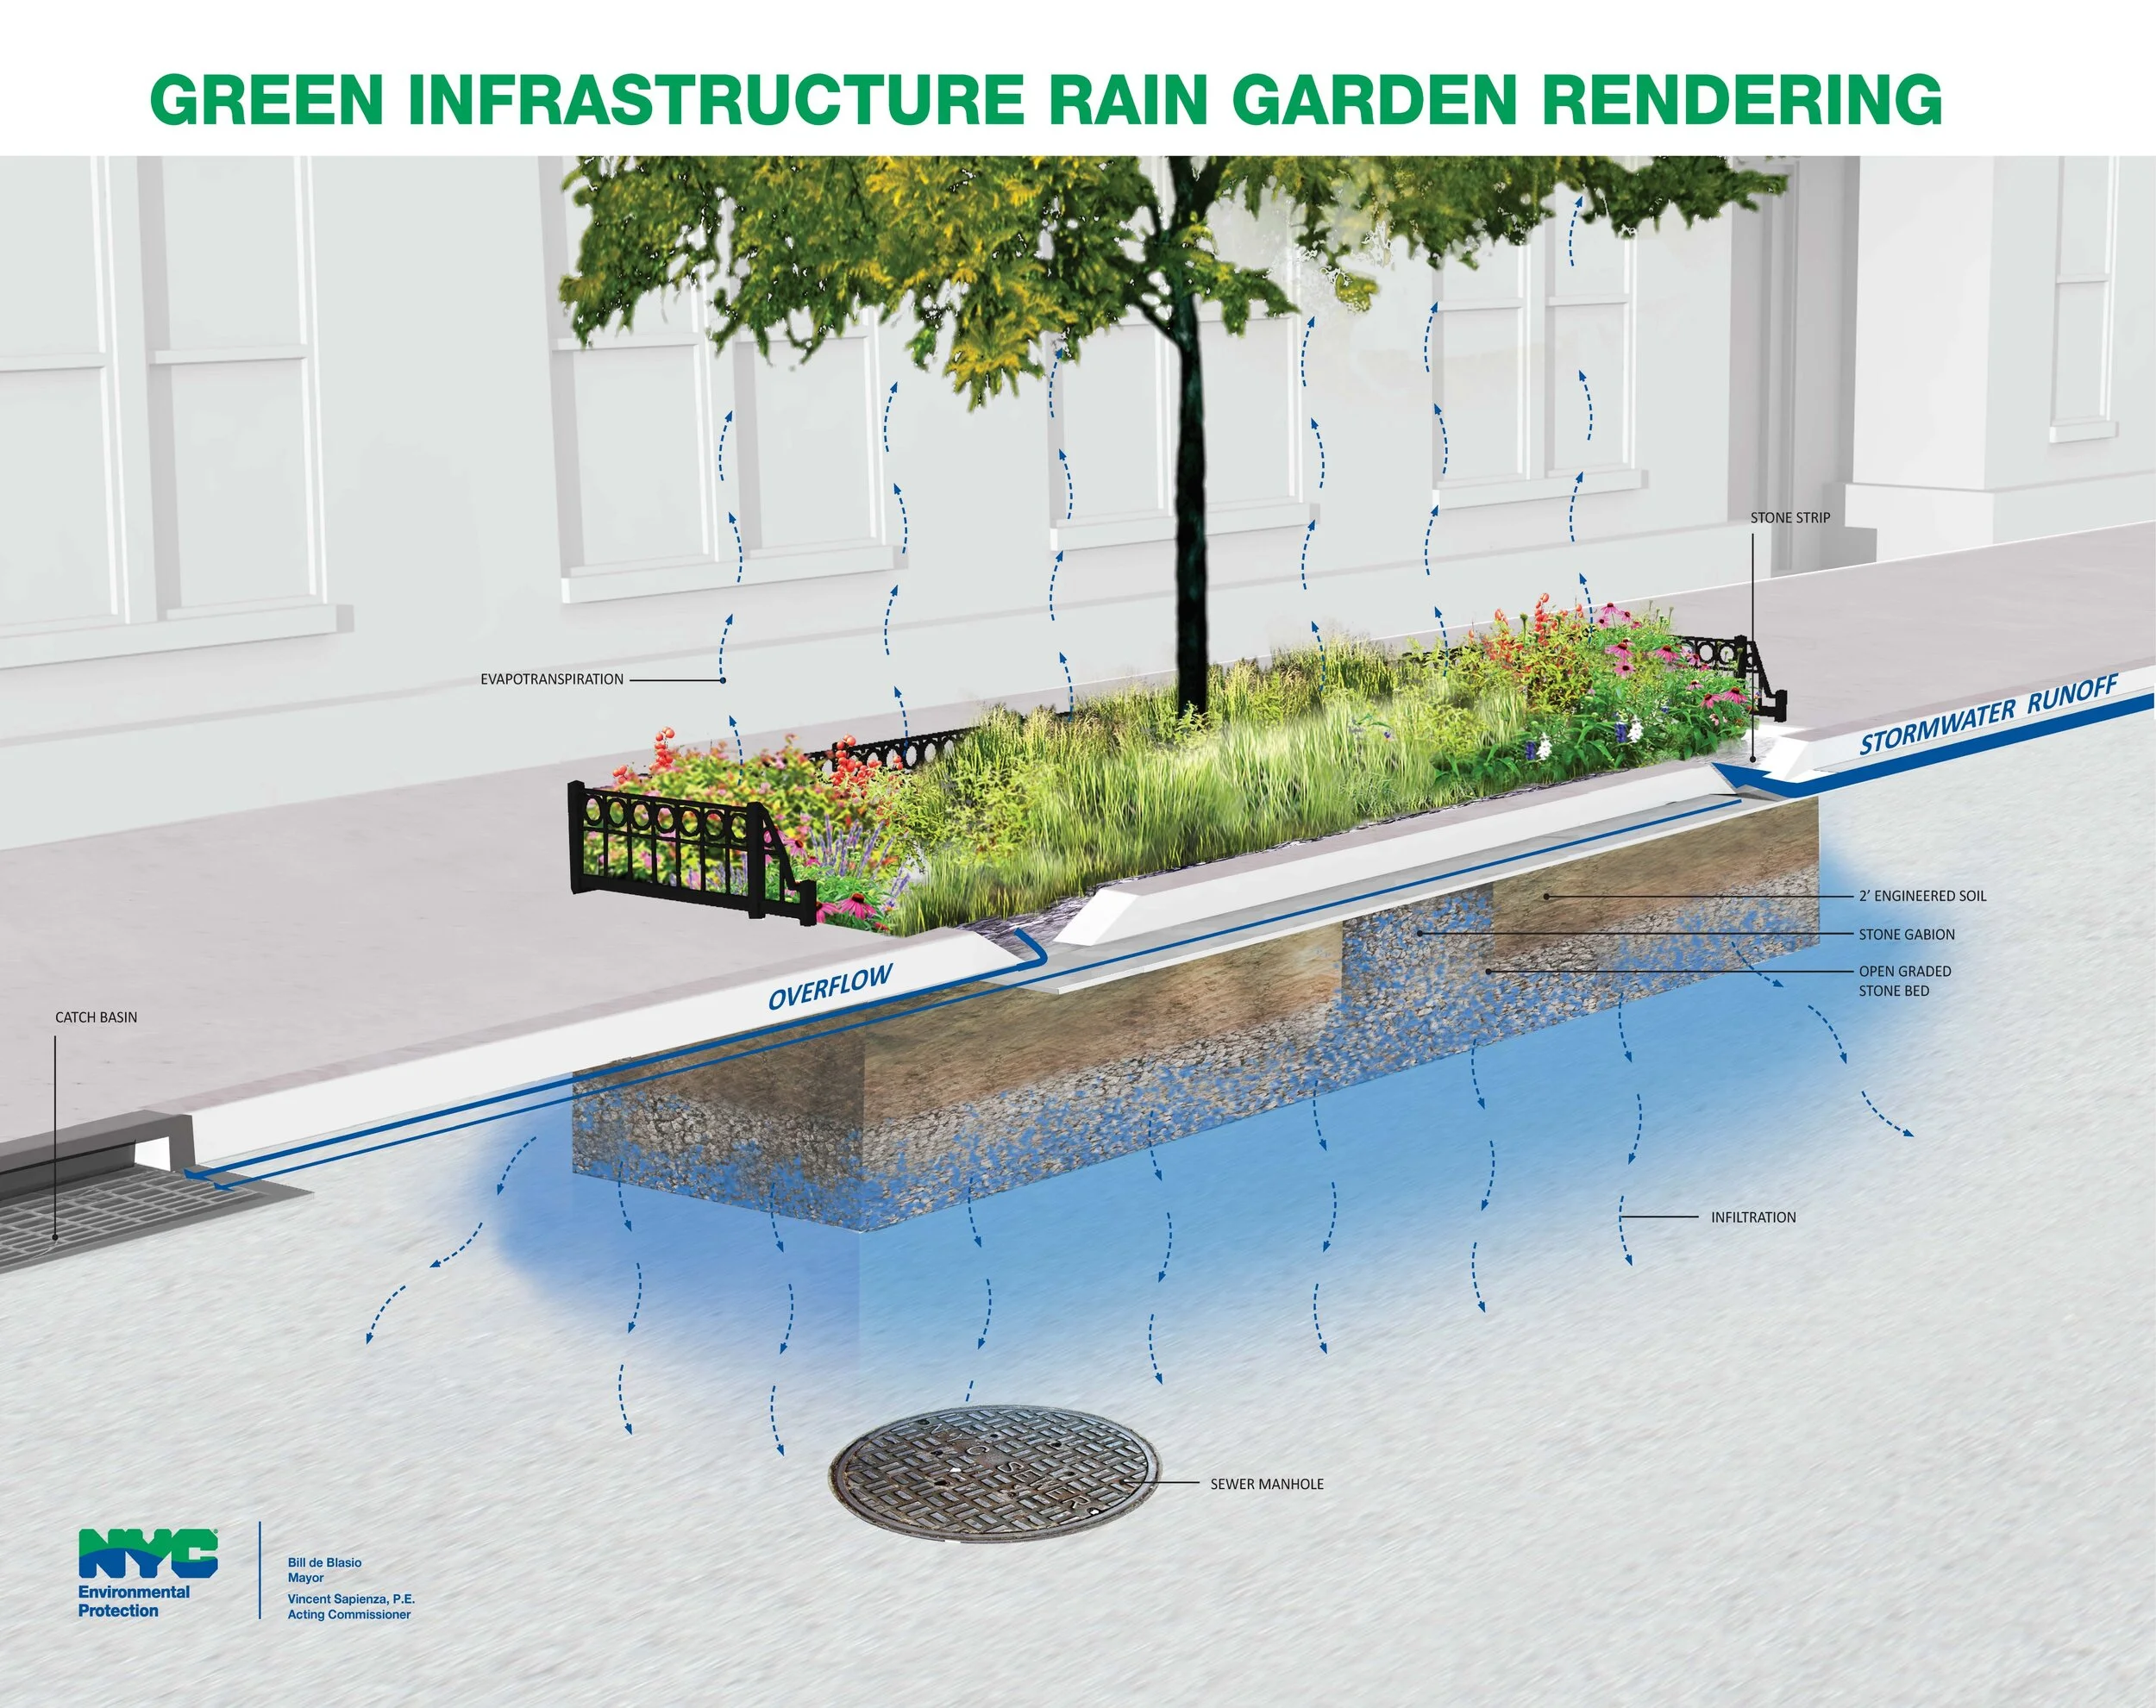
nyc_diagram.jpeg


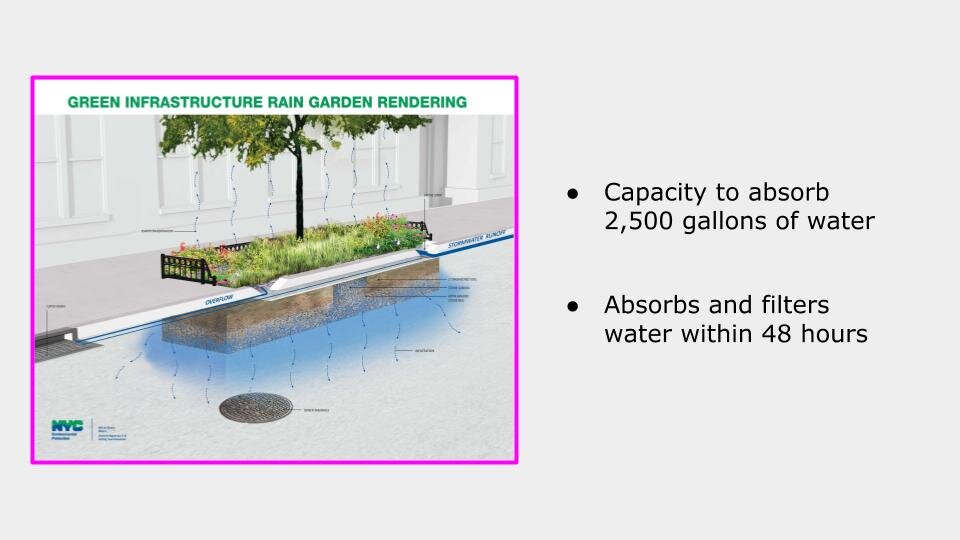
I also looked at the Rain Garden diagram made by the city and thought about the movement flows and which elements I could bring to the surface:

With the sensors I had available (in terms of time, money and availability), I decided to measure temperature, humidity and soil moisture. I also wanted to incorporate a water level sensor, but there was no rain in the forecast, so I decided to focus on what I would be able to measure.


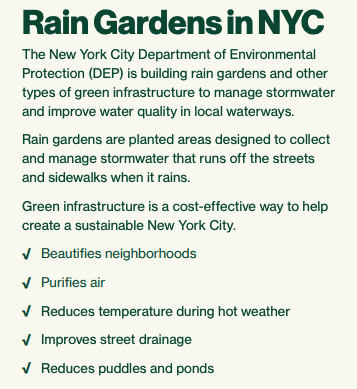
Next, I thought about mapping these measurements to the city Rain Garden outcomes:

NYC_raingarden_about.png


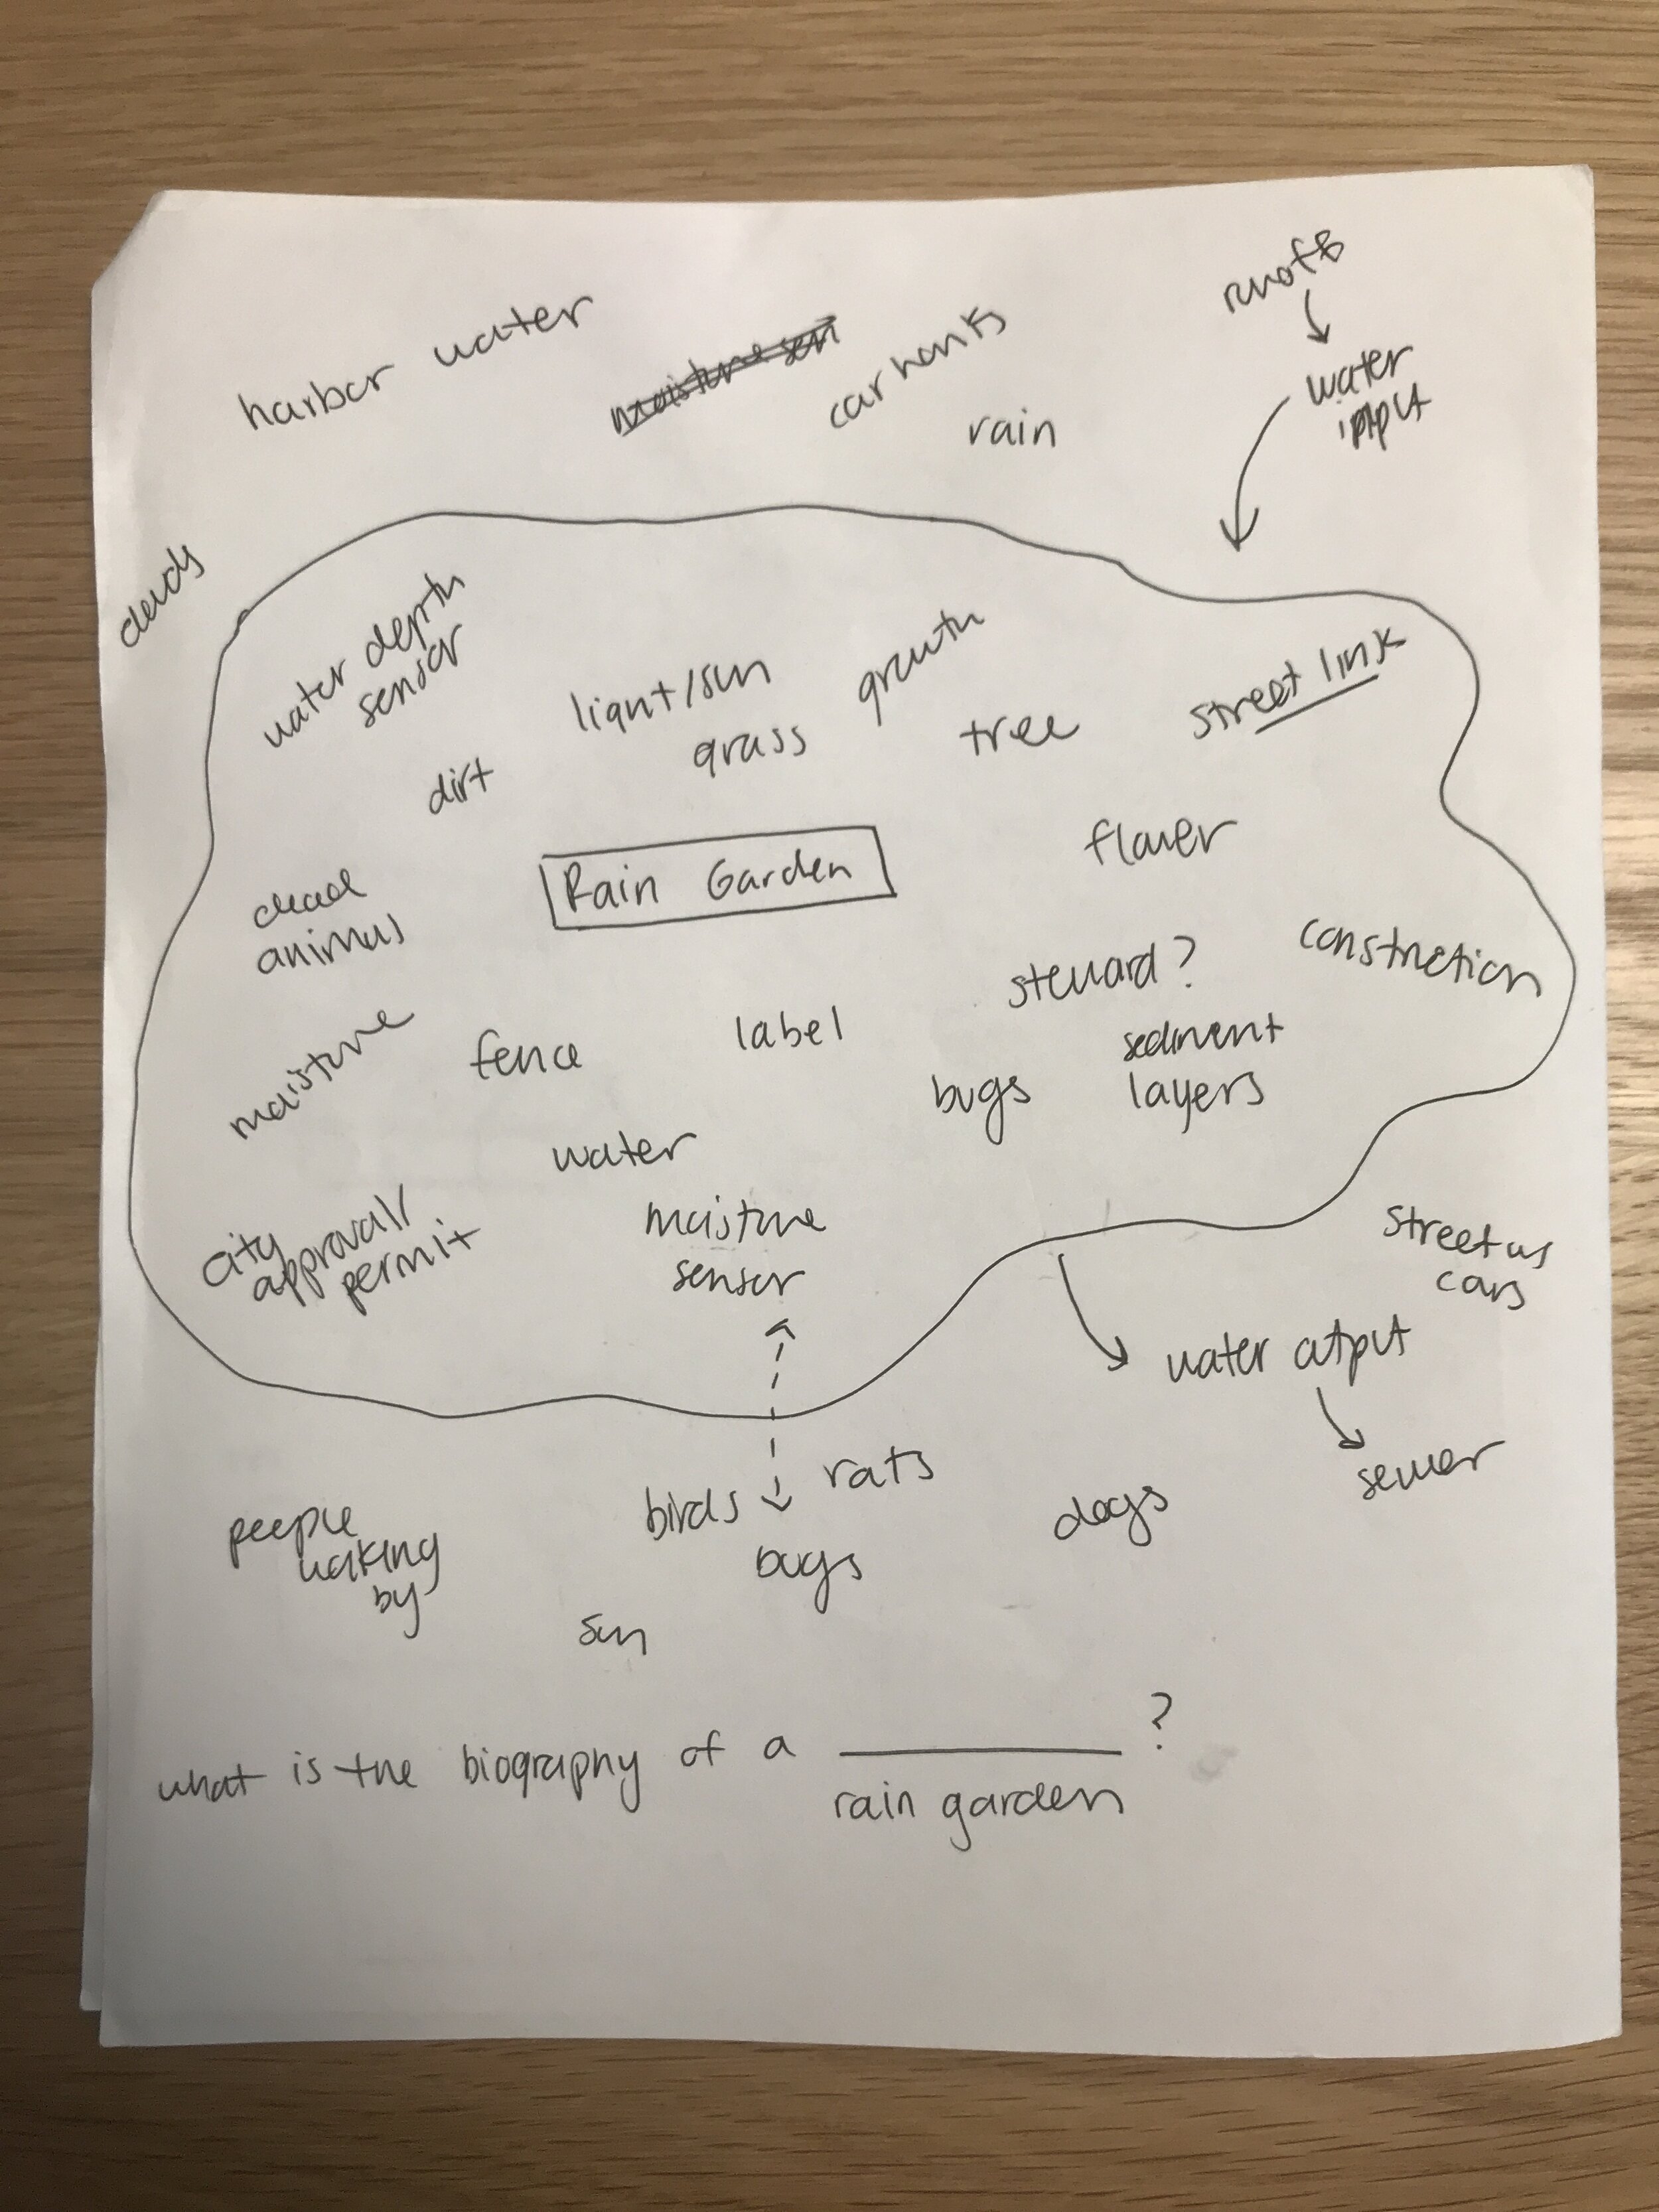
Next I listed out all of the part of the system I wanted to draw attention to and drew out where this information would go physically in the rain garden:

raingarden_map.JPG

I mocked up signs in illustrator, printed and laminated them. Although these are simple printed signs, in terms of design, the goal of this intervention is to also ask: what if these data points had been integrated into the original garden design plan? How would that change the shape of the fence or how community members conceive of the rain gardens?

In terms of the data collecting device, I imagined a device that data stewards could use and I also wanted the device to be something that a citizen scientist could make. I decided to use legos for the enclosure in order to evoke a construction kit feel.

lego.JPG

Interaction

The agency in this interaction lies with the steward. The communication of information is mediated by the garden steward who takes measurements with the device. In this interaction I was hoping that the steward would go inside the garden and get close to the dirt, literally making themselves part of the infrastructure.

I implemented this device in the morning on a weekday, so although a few people looked over and seemed to read the signs, no one stopped to inspect them more closely. The interaction I was hoping for was that people would read the signs, become award of the rain garden, learn about the system it is a part of and reconsider their own role in this system. The agency of the passerby would be how they act in relation to the rain garden receiving this information. This might change if this were a permanent installation. 

Reflections and Future thoughts

If I were to do another iteration of this project, I would like to experiment with a permanently installed devices and a more creative output. I think it’s important to display the data, but would like to hide it a bit more, which would require more work from citizens to connect the dots. Perhaps I could draw on the ground with chalk or paint or install several small interactive devices. I’d also be interested in getting the rain garden “online” or into an “electronic” format either in real-time or by uploading the data after a collection period. I think additional insight could come from connecting two rain gardens or having them “communicate.” I would be interested in exposing other forms of data such as plant poses or using computer vision to understand the garden dynamic spatially.


Week 1 Part 2: Choosing a Site

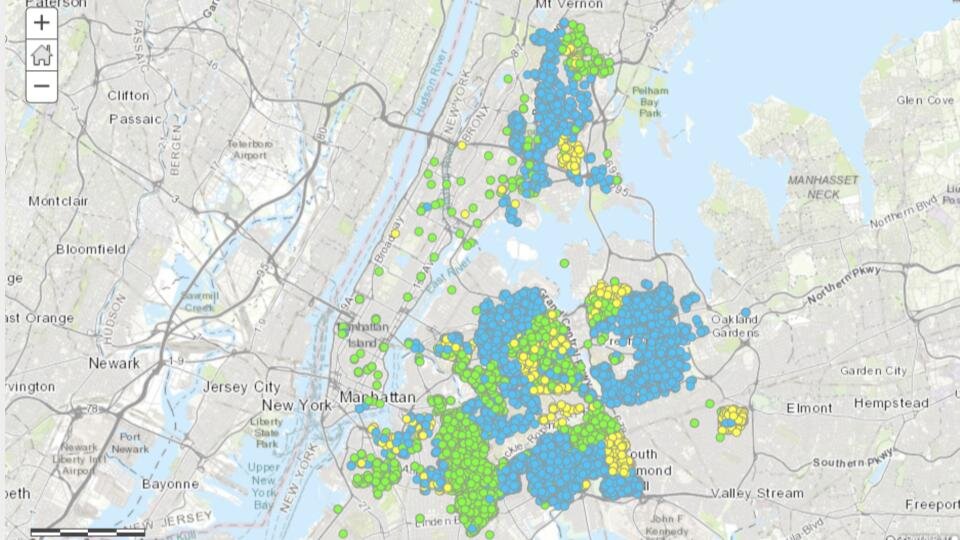
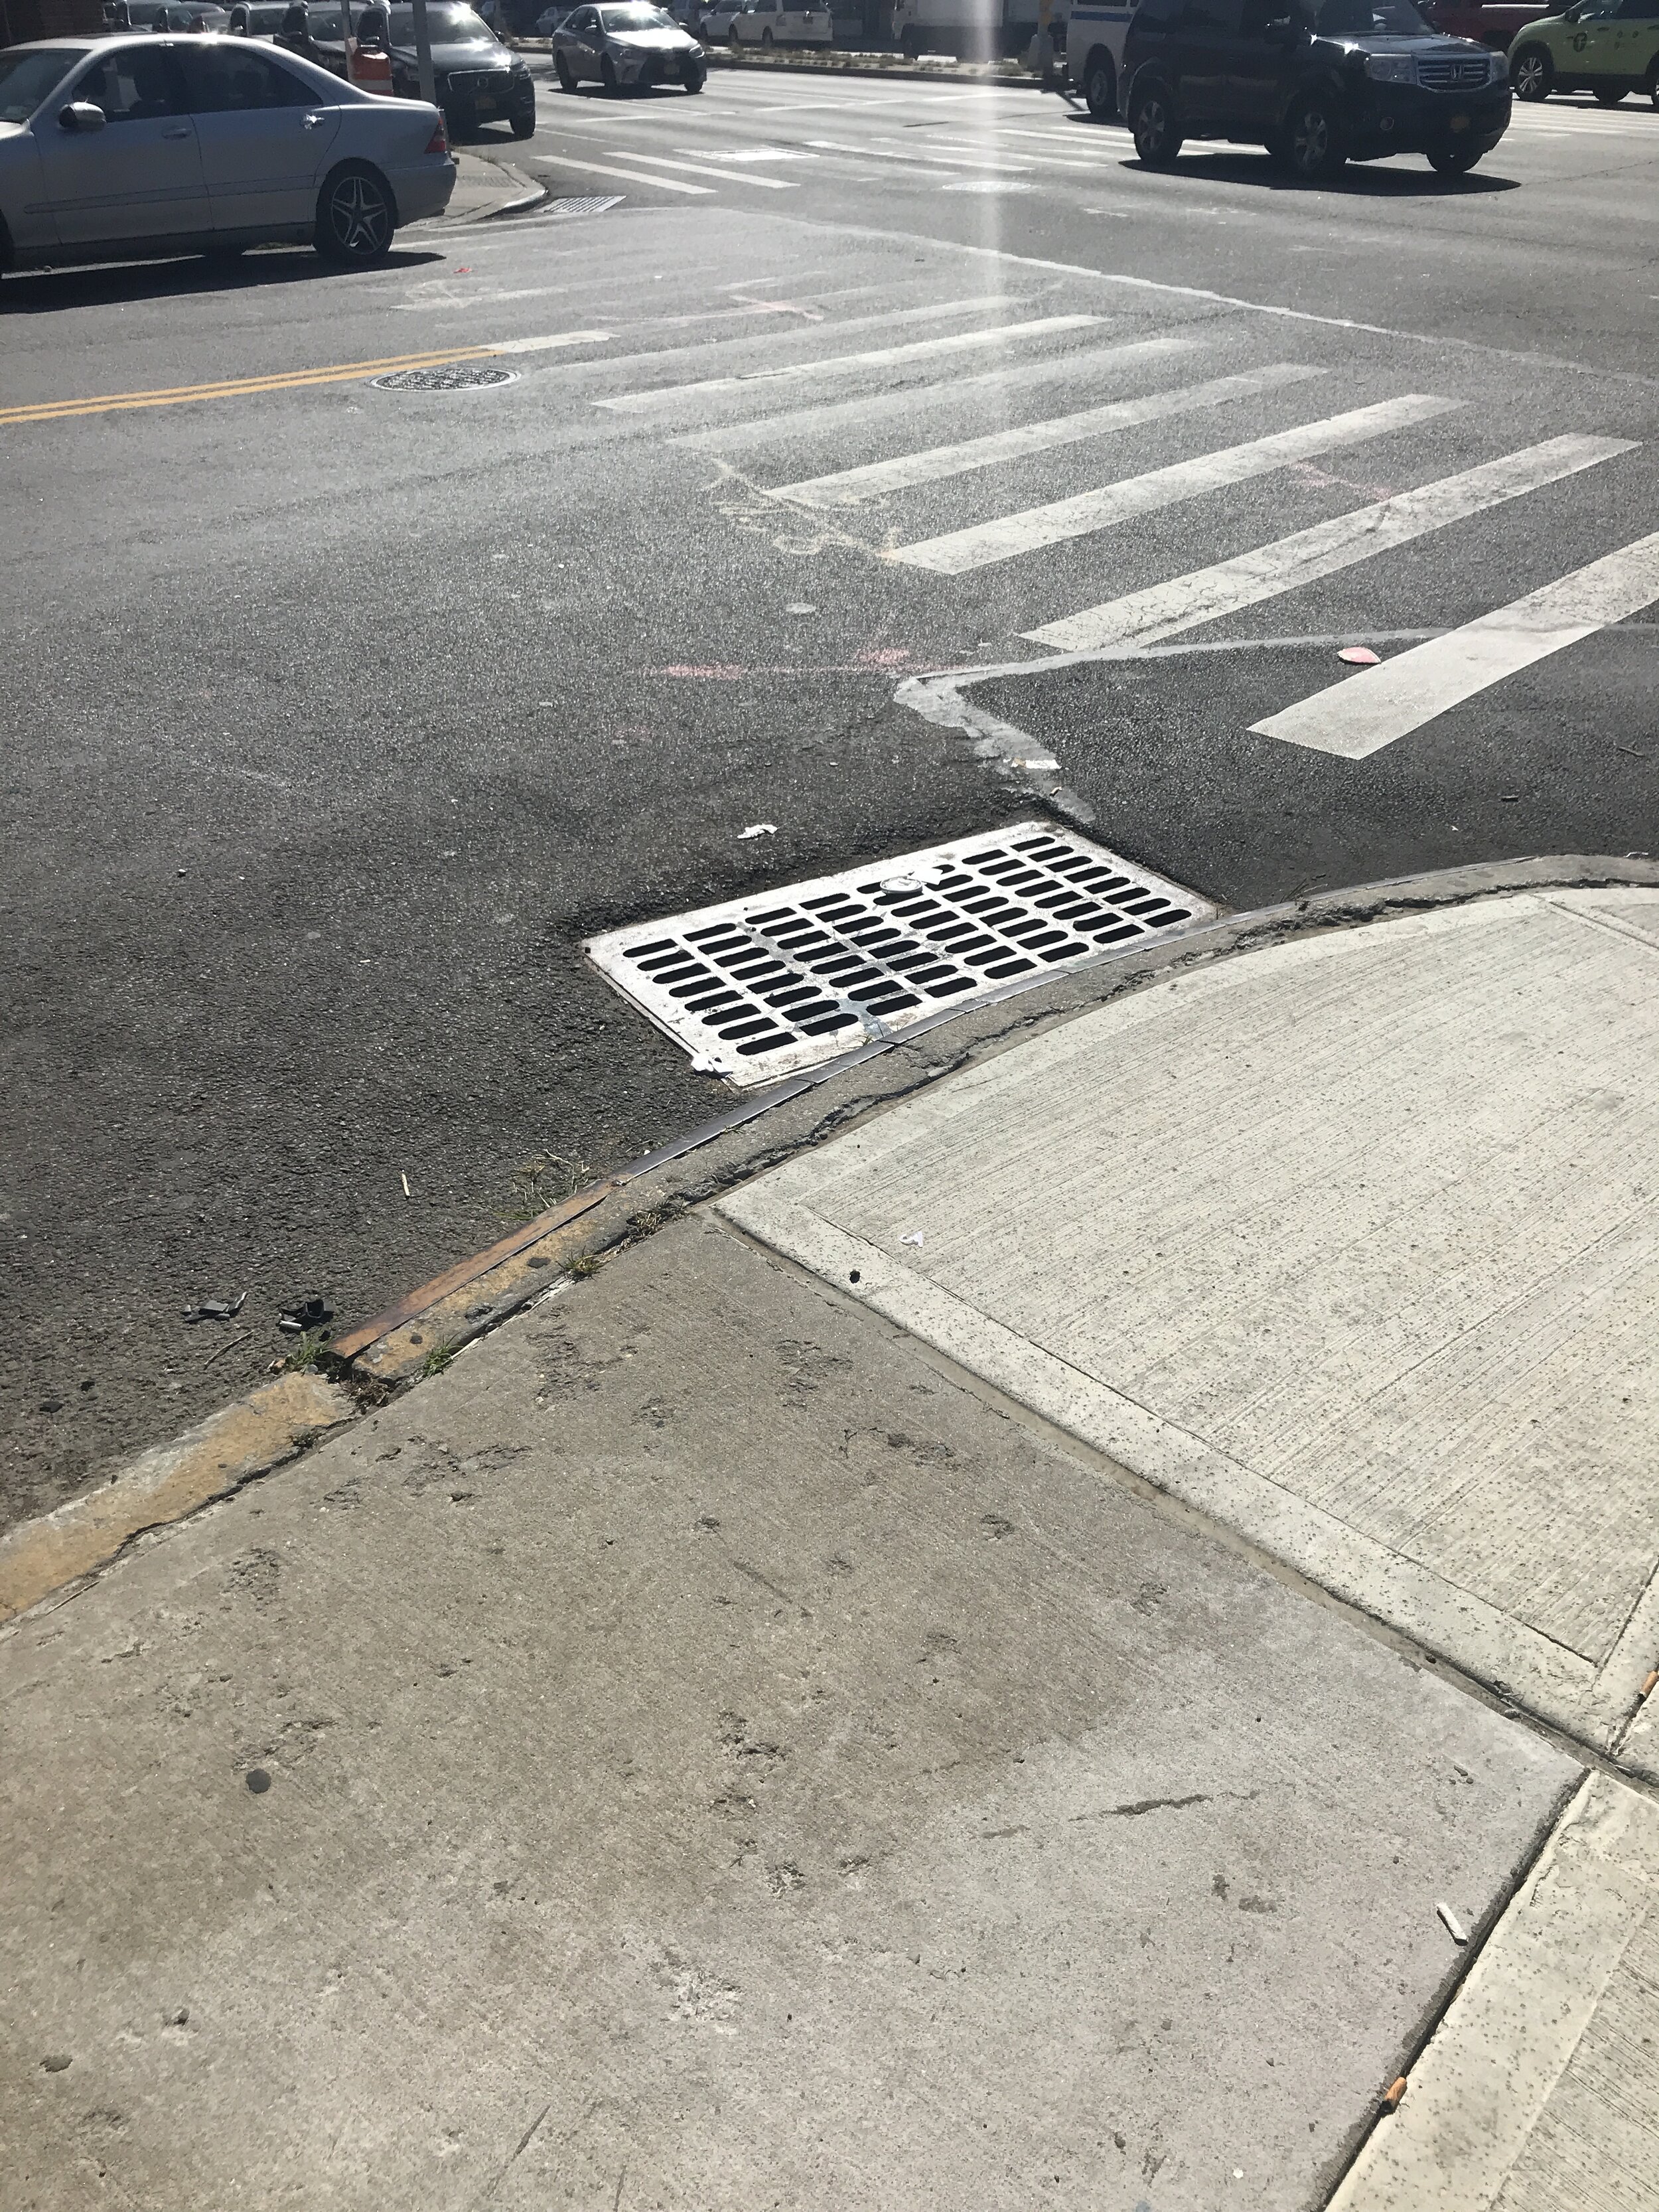
Using the city’s online rain garden mapper tool, I found a few potential sites near my apartment and took my bike out one morning to check them out. The too lists all planned, under construction and completed sites, so I visited a variety to see what they looked like:

Stop 1

stop1.png

Site 1

IMG_0833.JPG
  • Bus stop

  • Very busy

  • Lots of trash

  • Lots of entry points (not traditional ran garden/linked to sewer)

  • Couple of trees

  • intersection


Stop 2

stop2.png

Site 2

  • Outside of coffee shop

  • New development

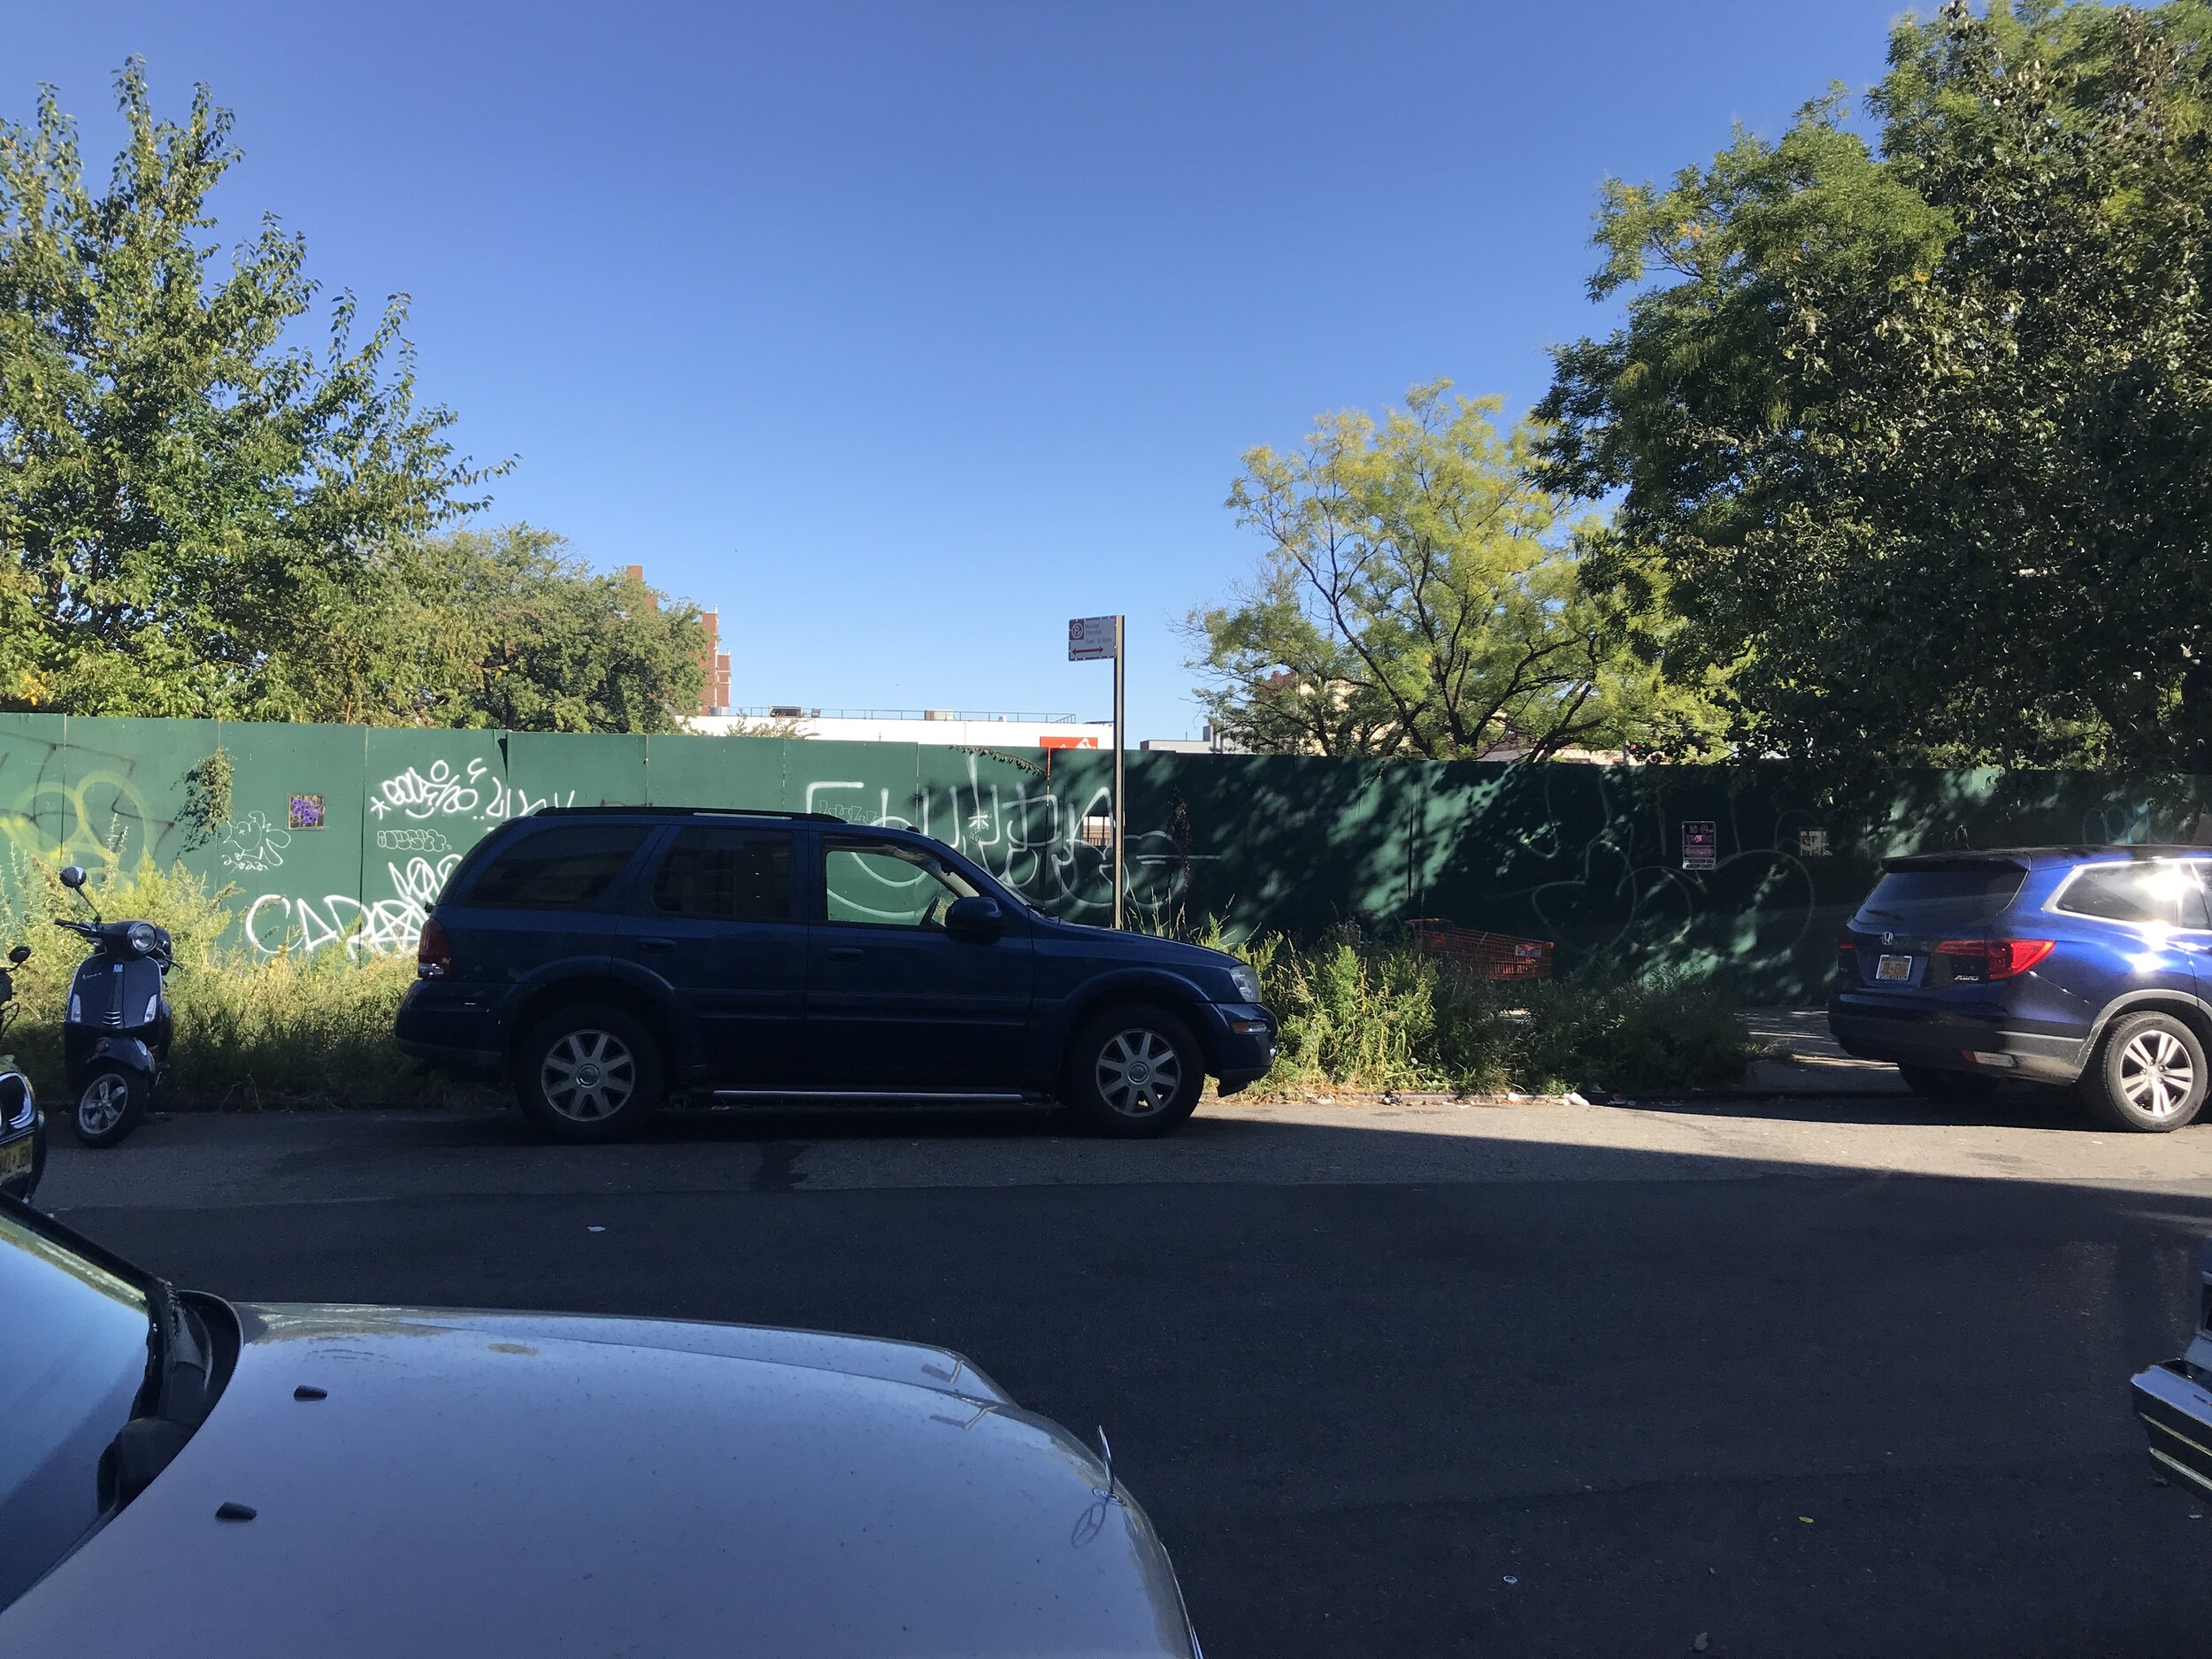
  • Across street from empty lot and weeds

  • 1 tree

  • Feels bare

  • Shaded in morning

  • Sewer at intersection

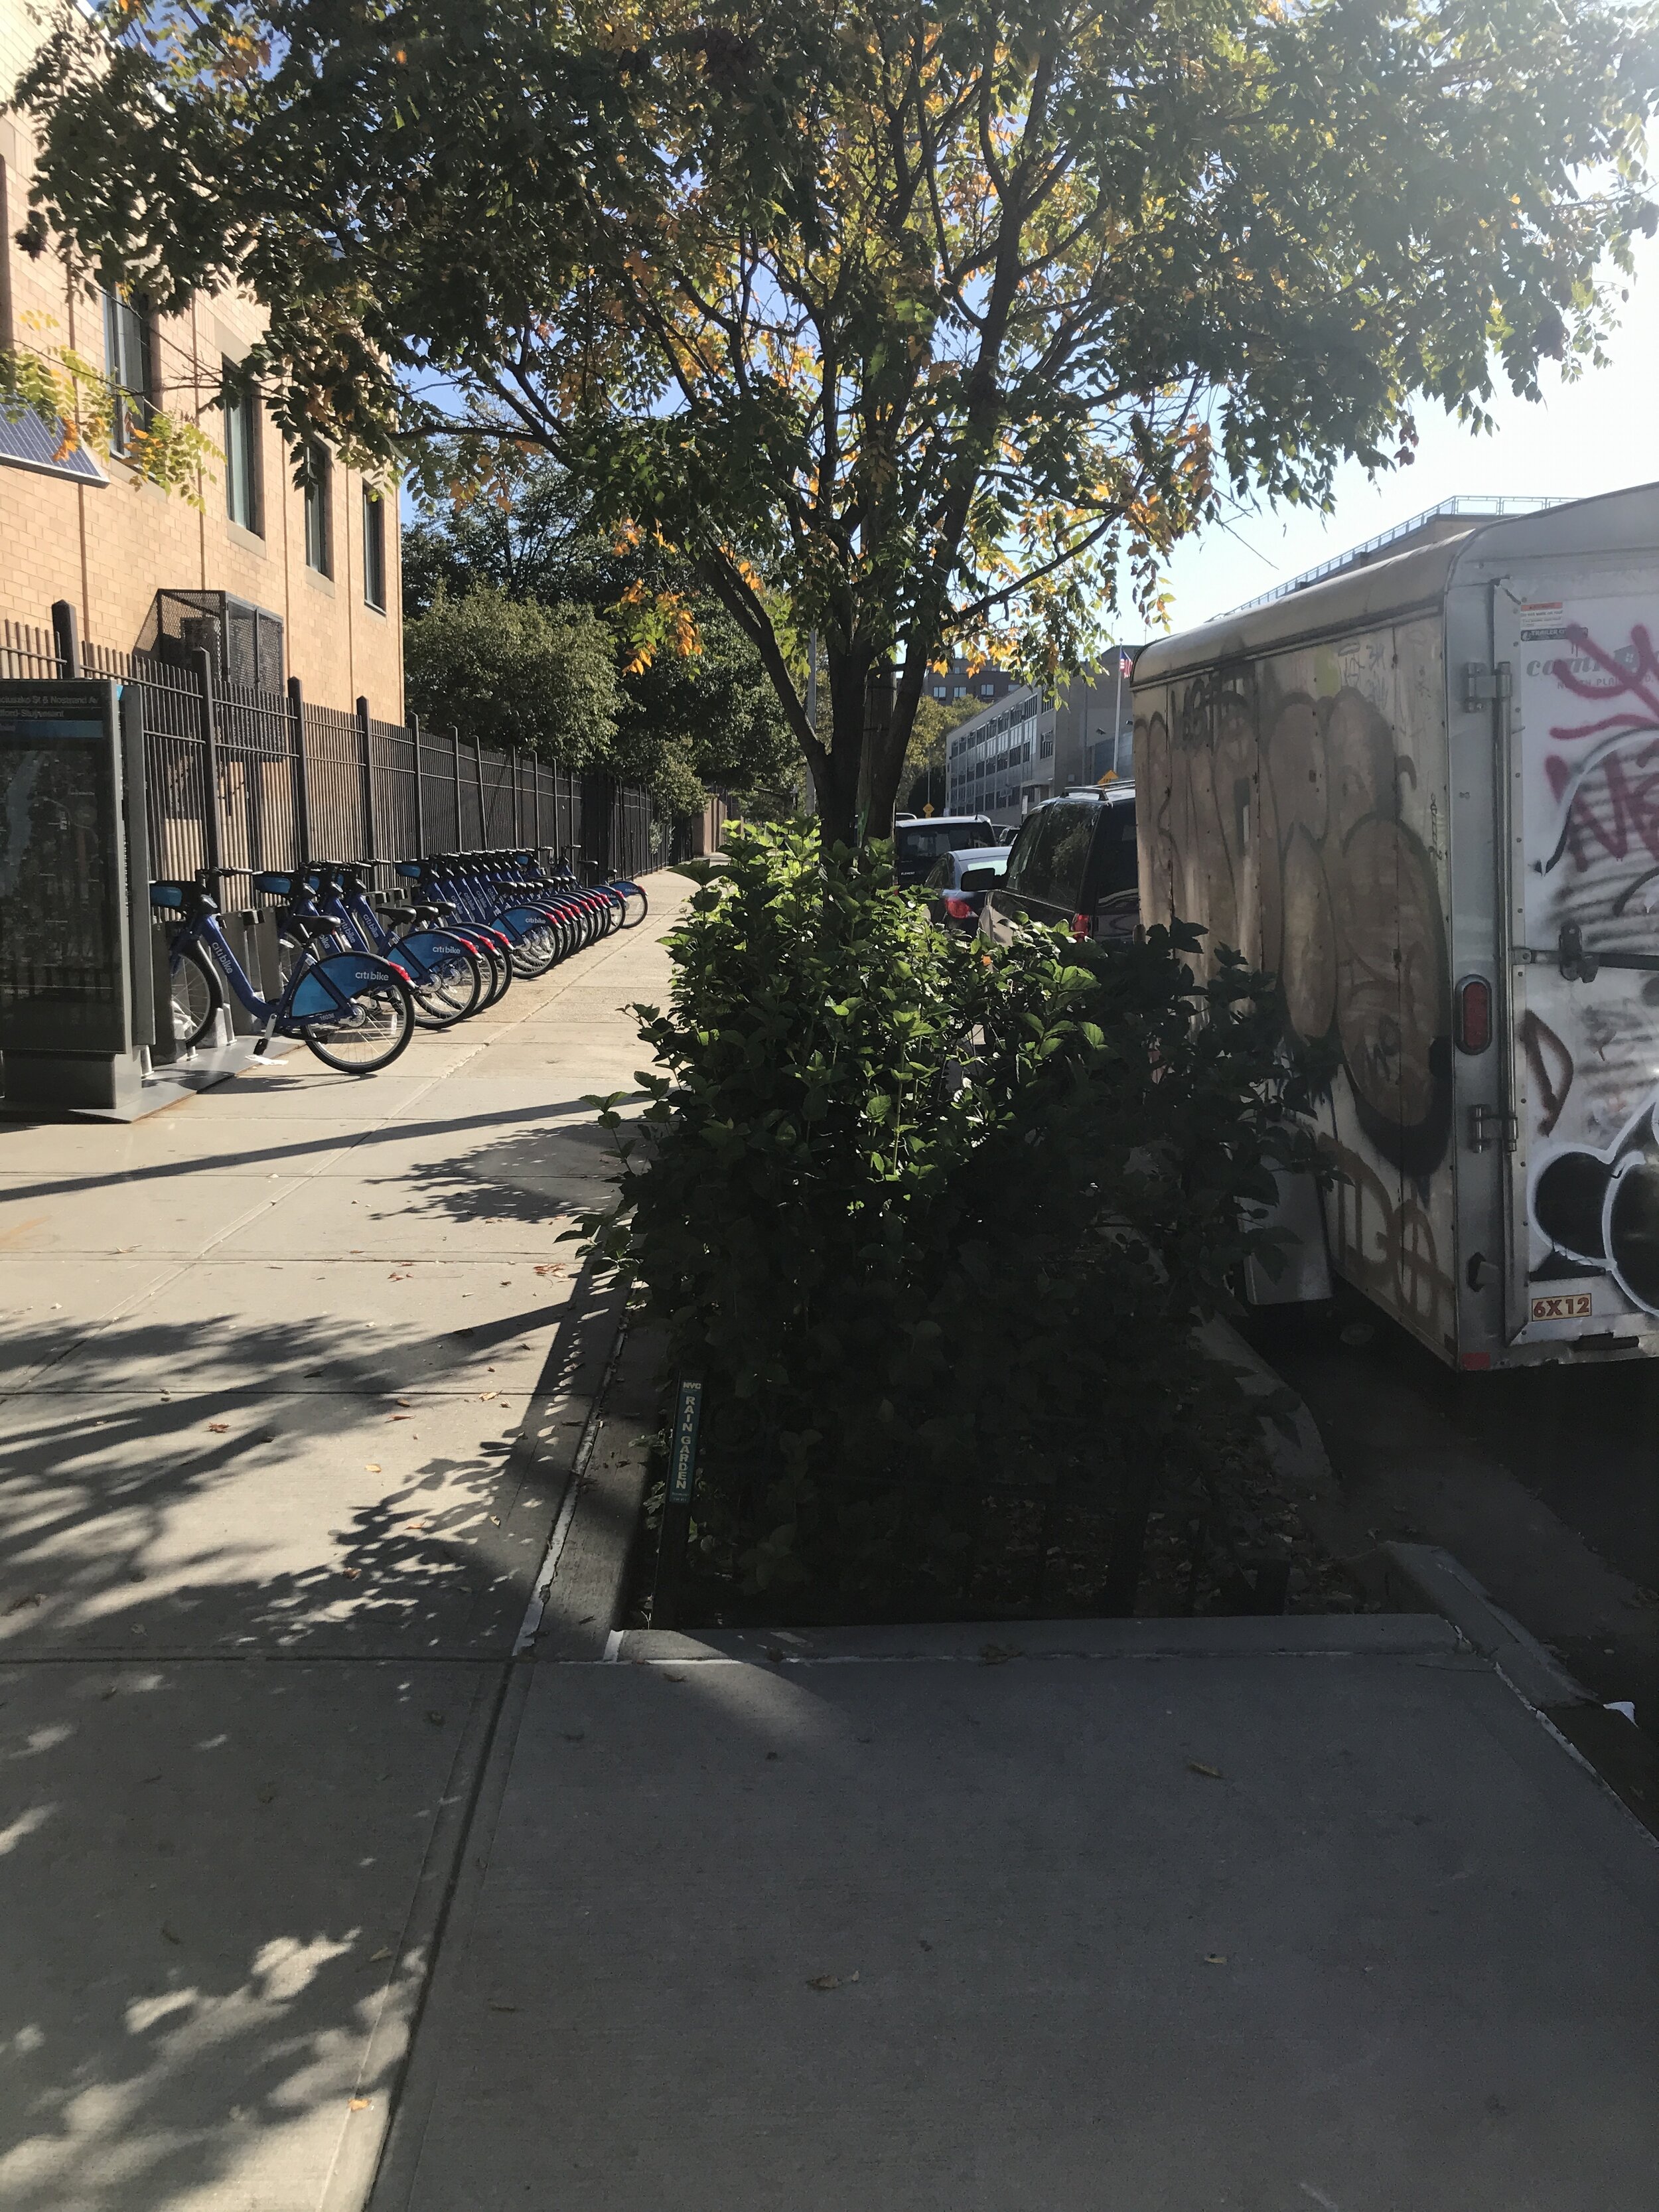
Site 3

  • Large tree, 2 bushes

  • Intersection less busy

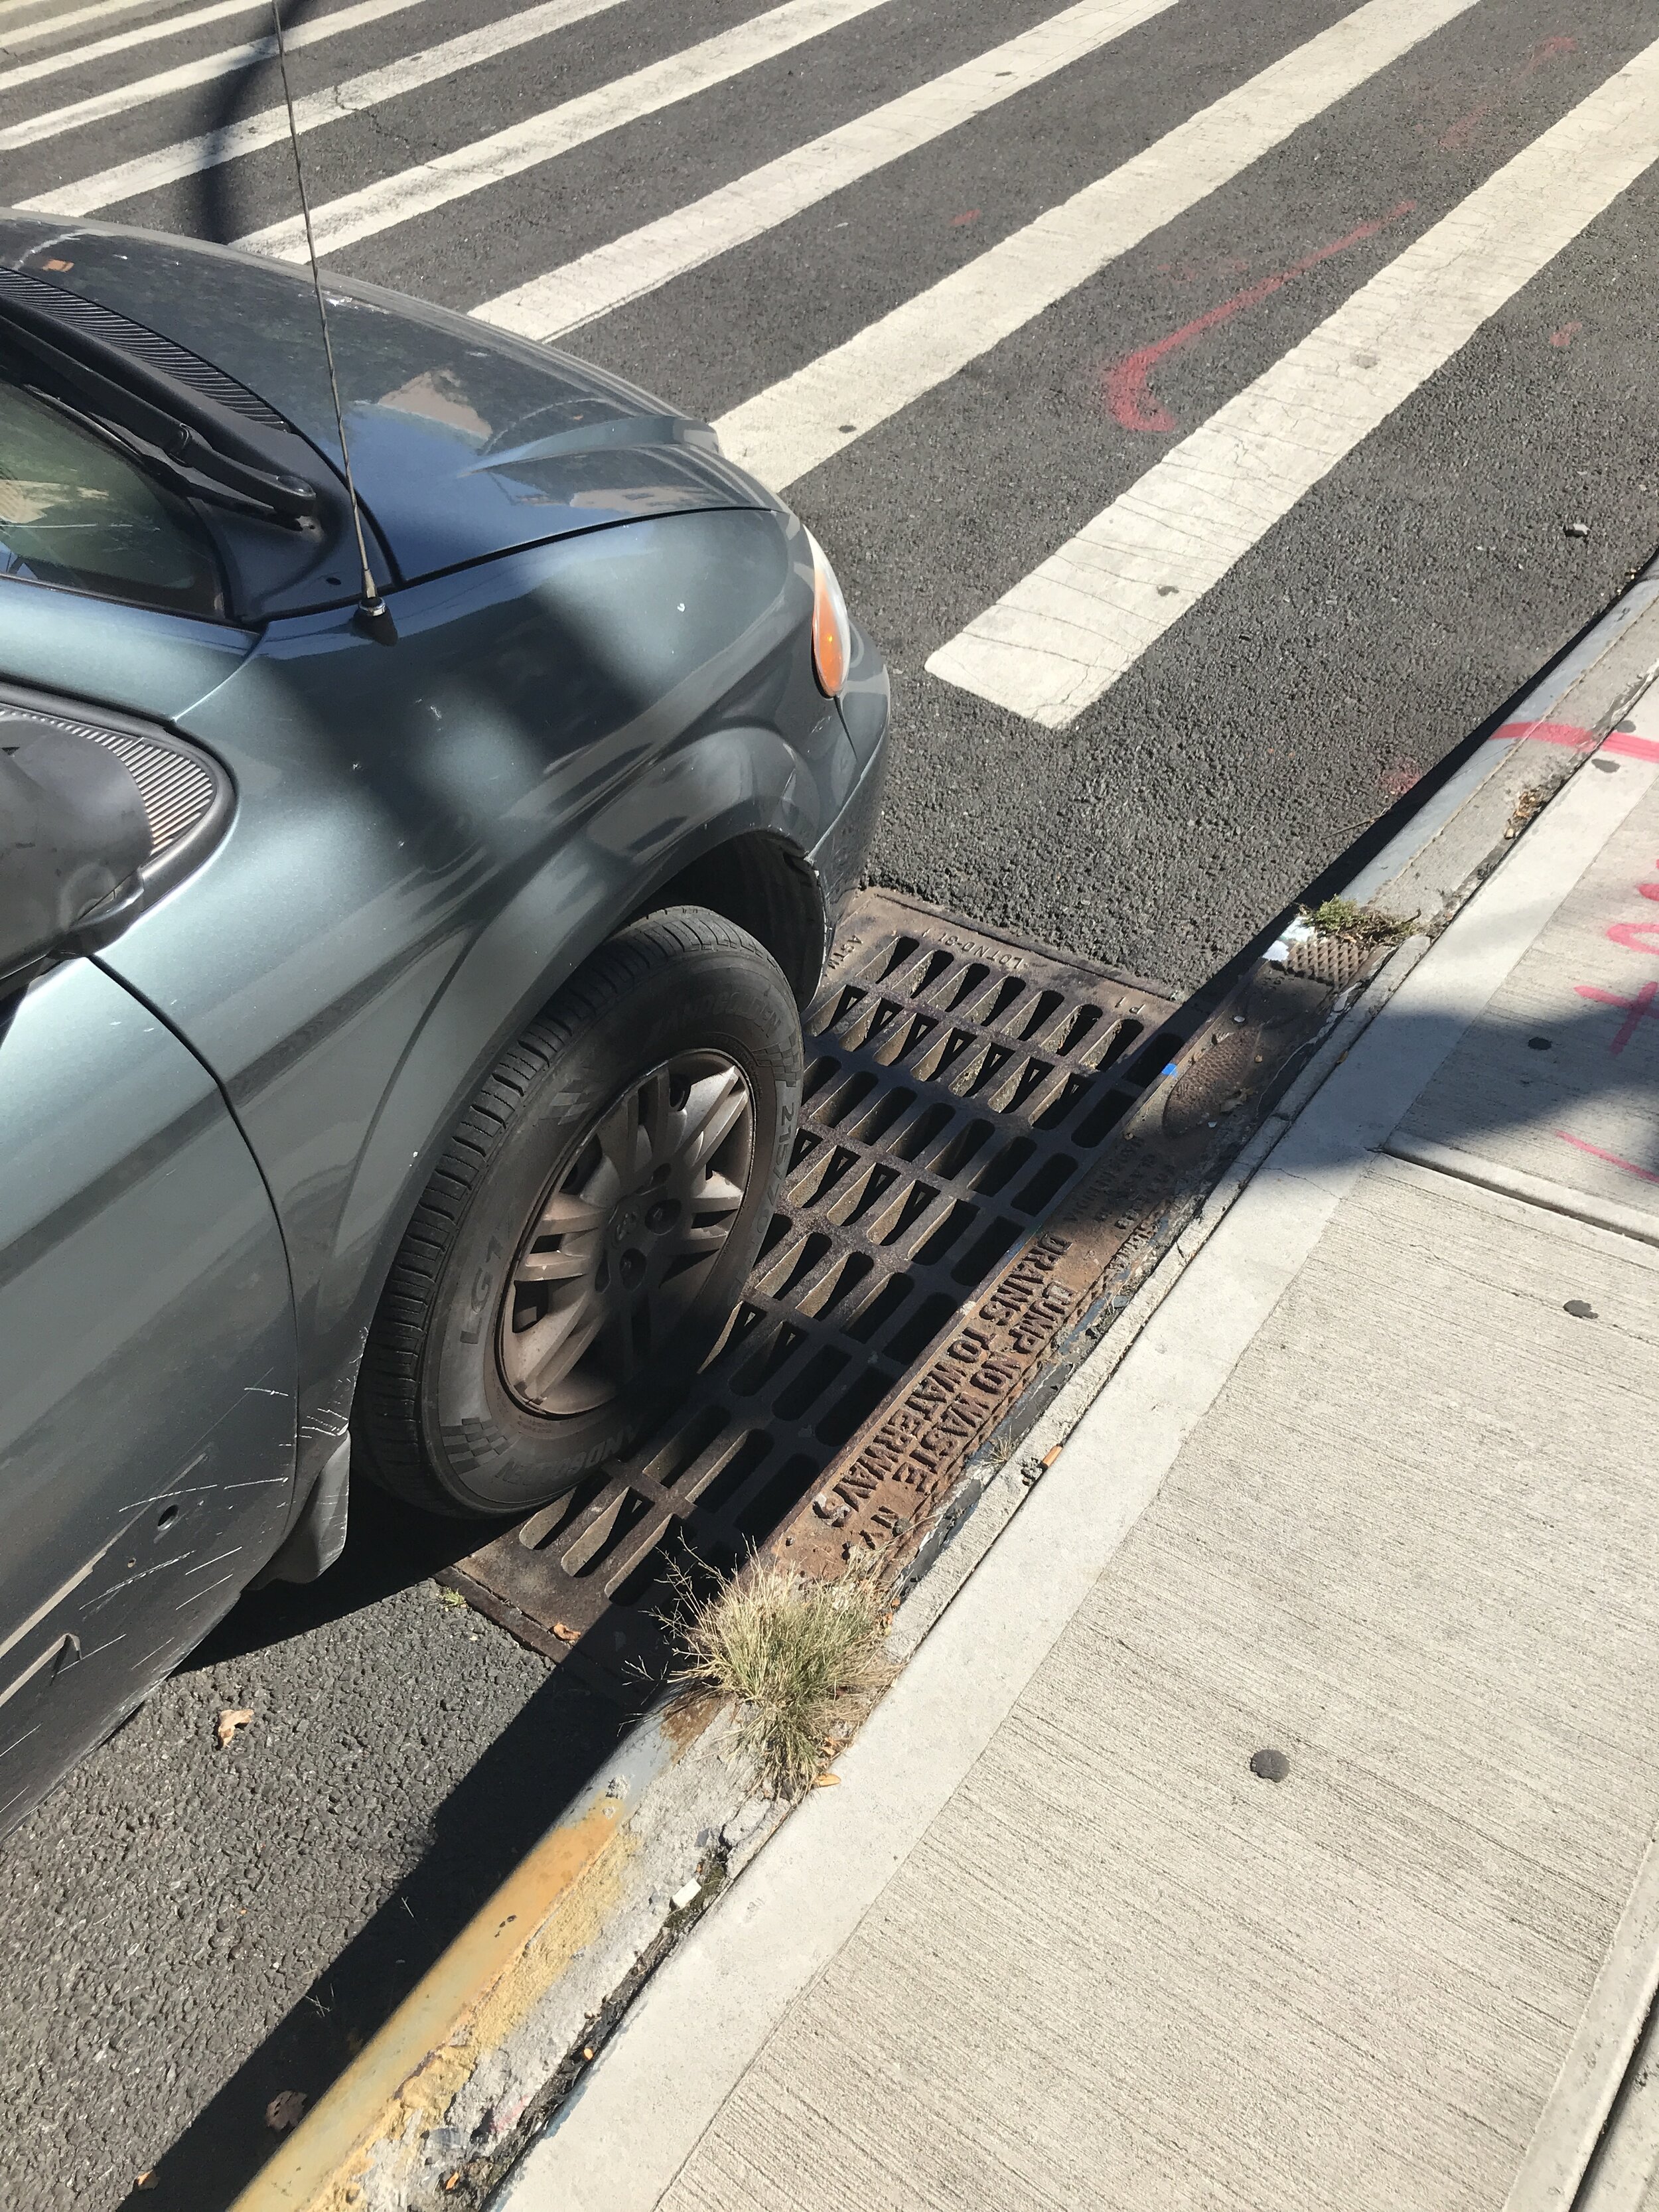
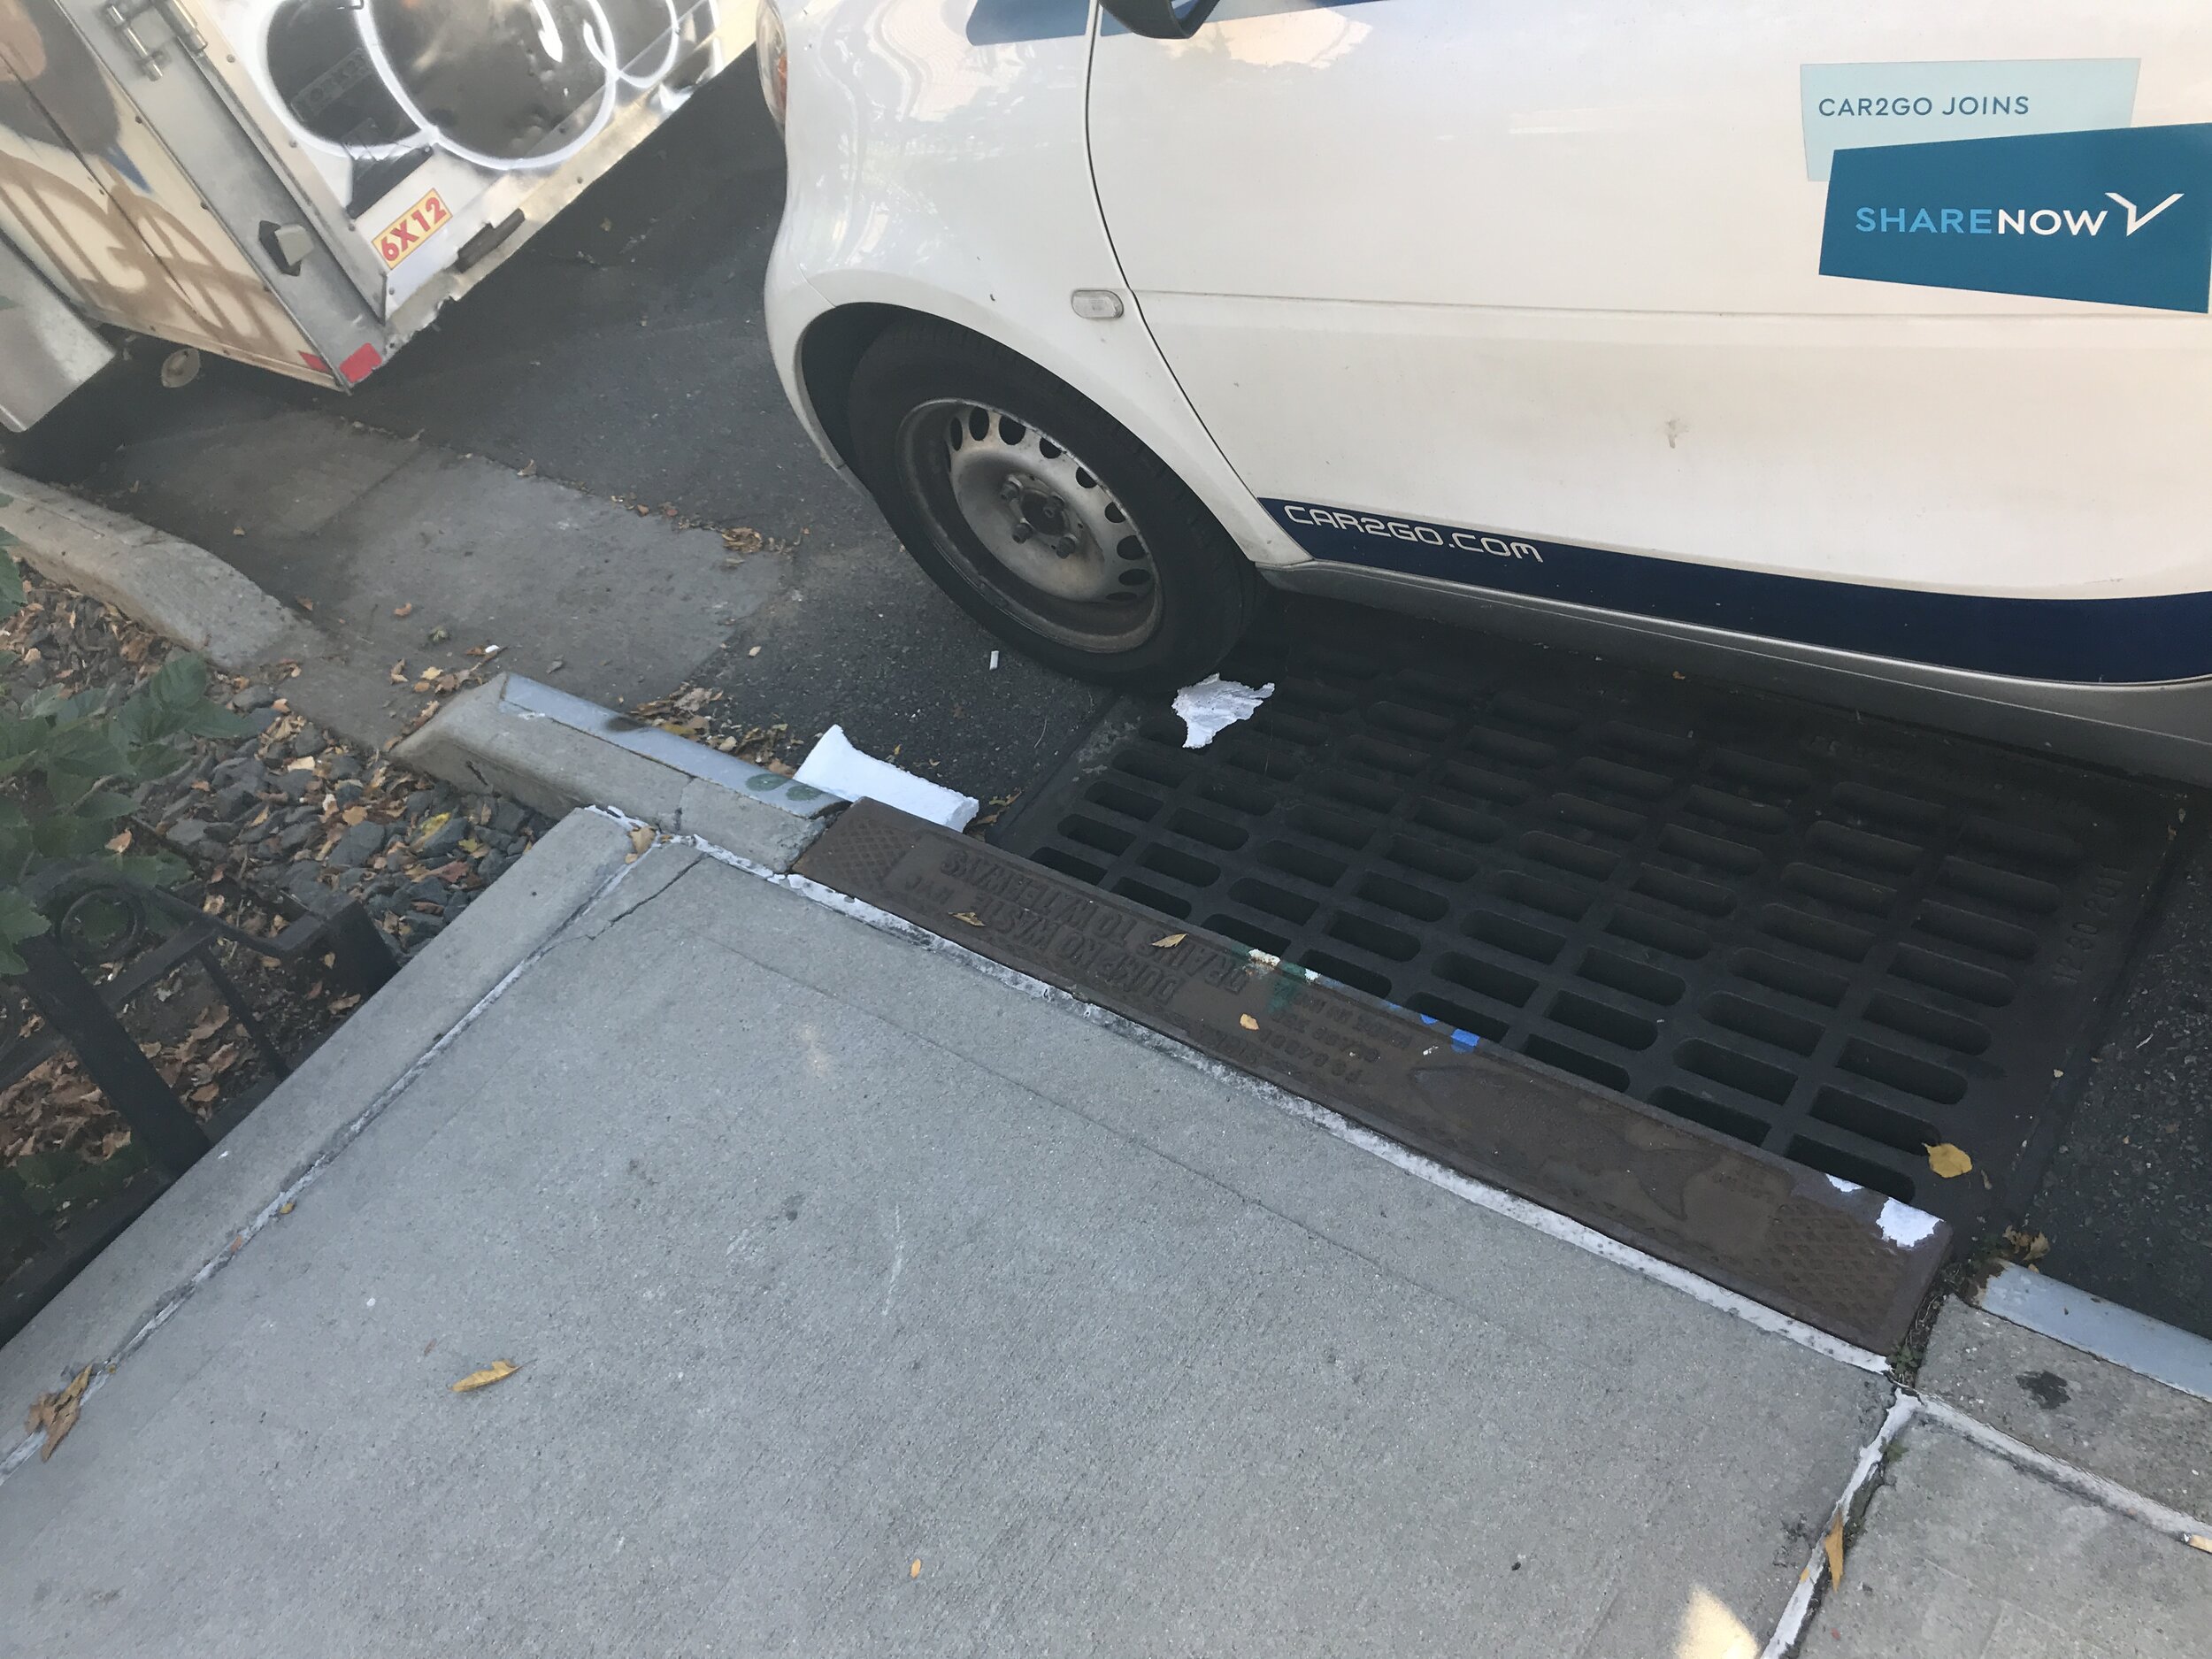
  • Storm drain

  • By citibike

  • Construction across street

  • Some trash

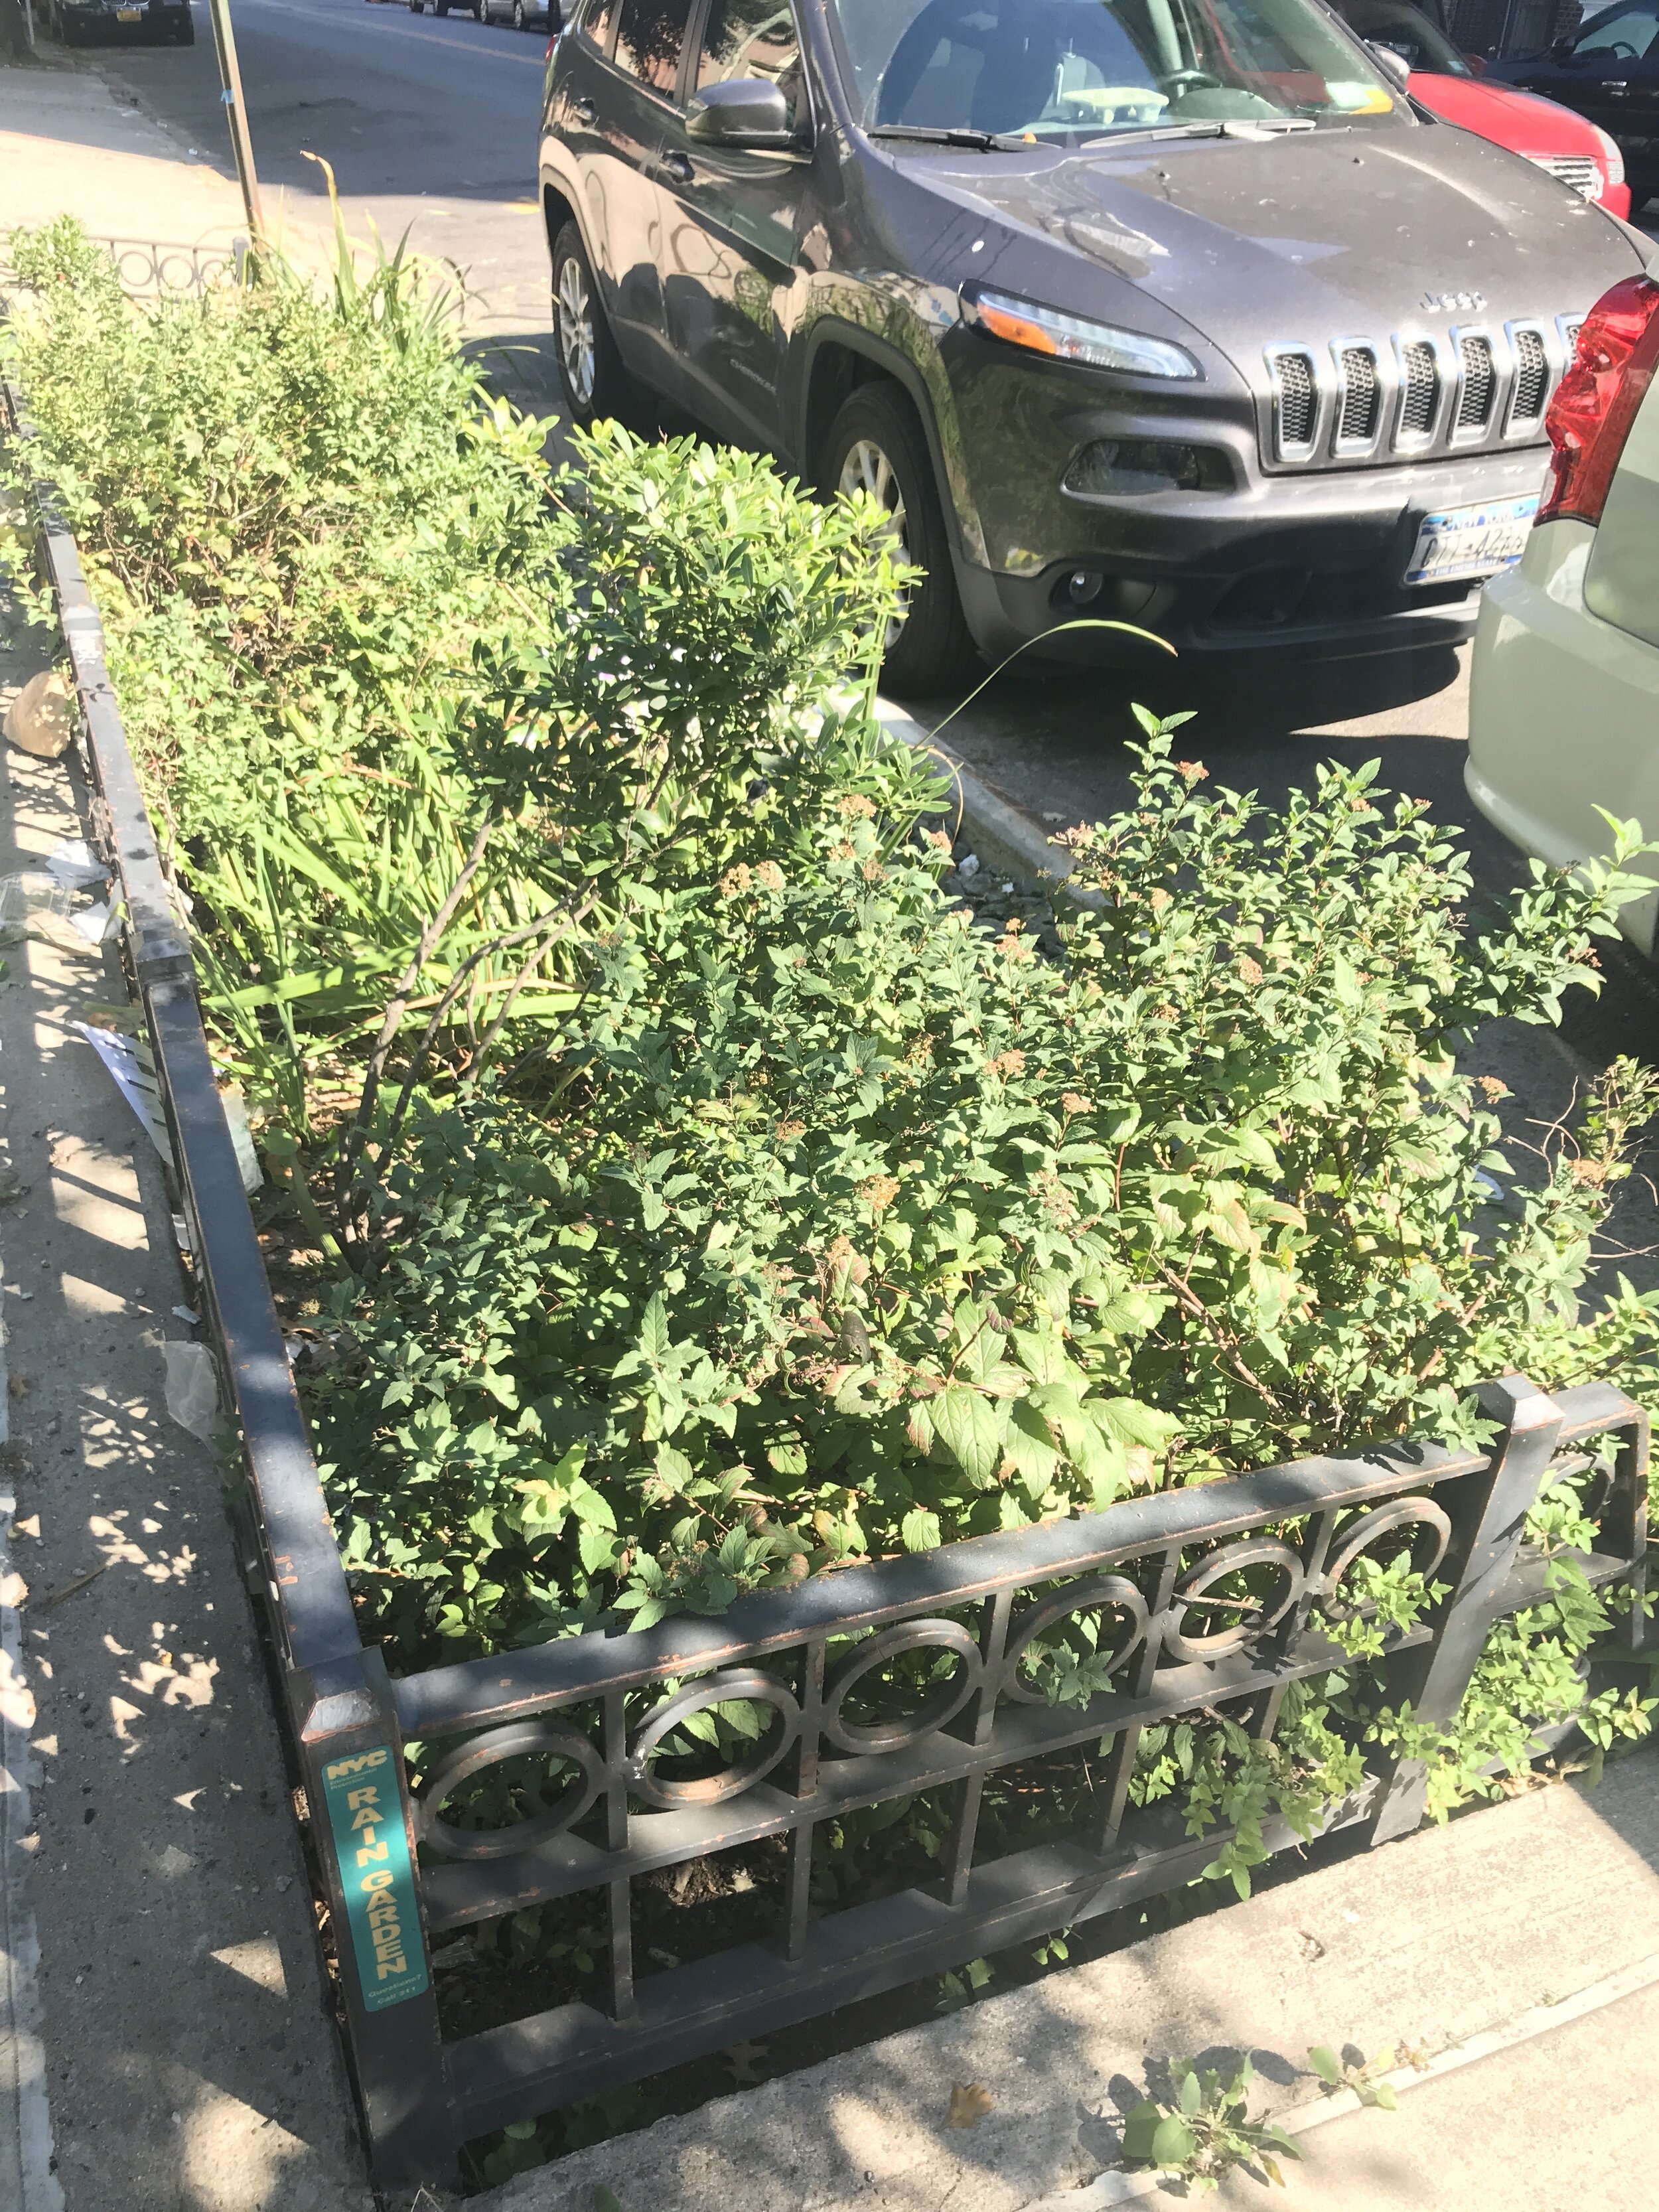
Site 4

  • 2 bushes, grass, flowers

  • Tree

  • Some trash, paint

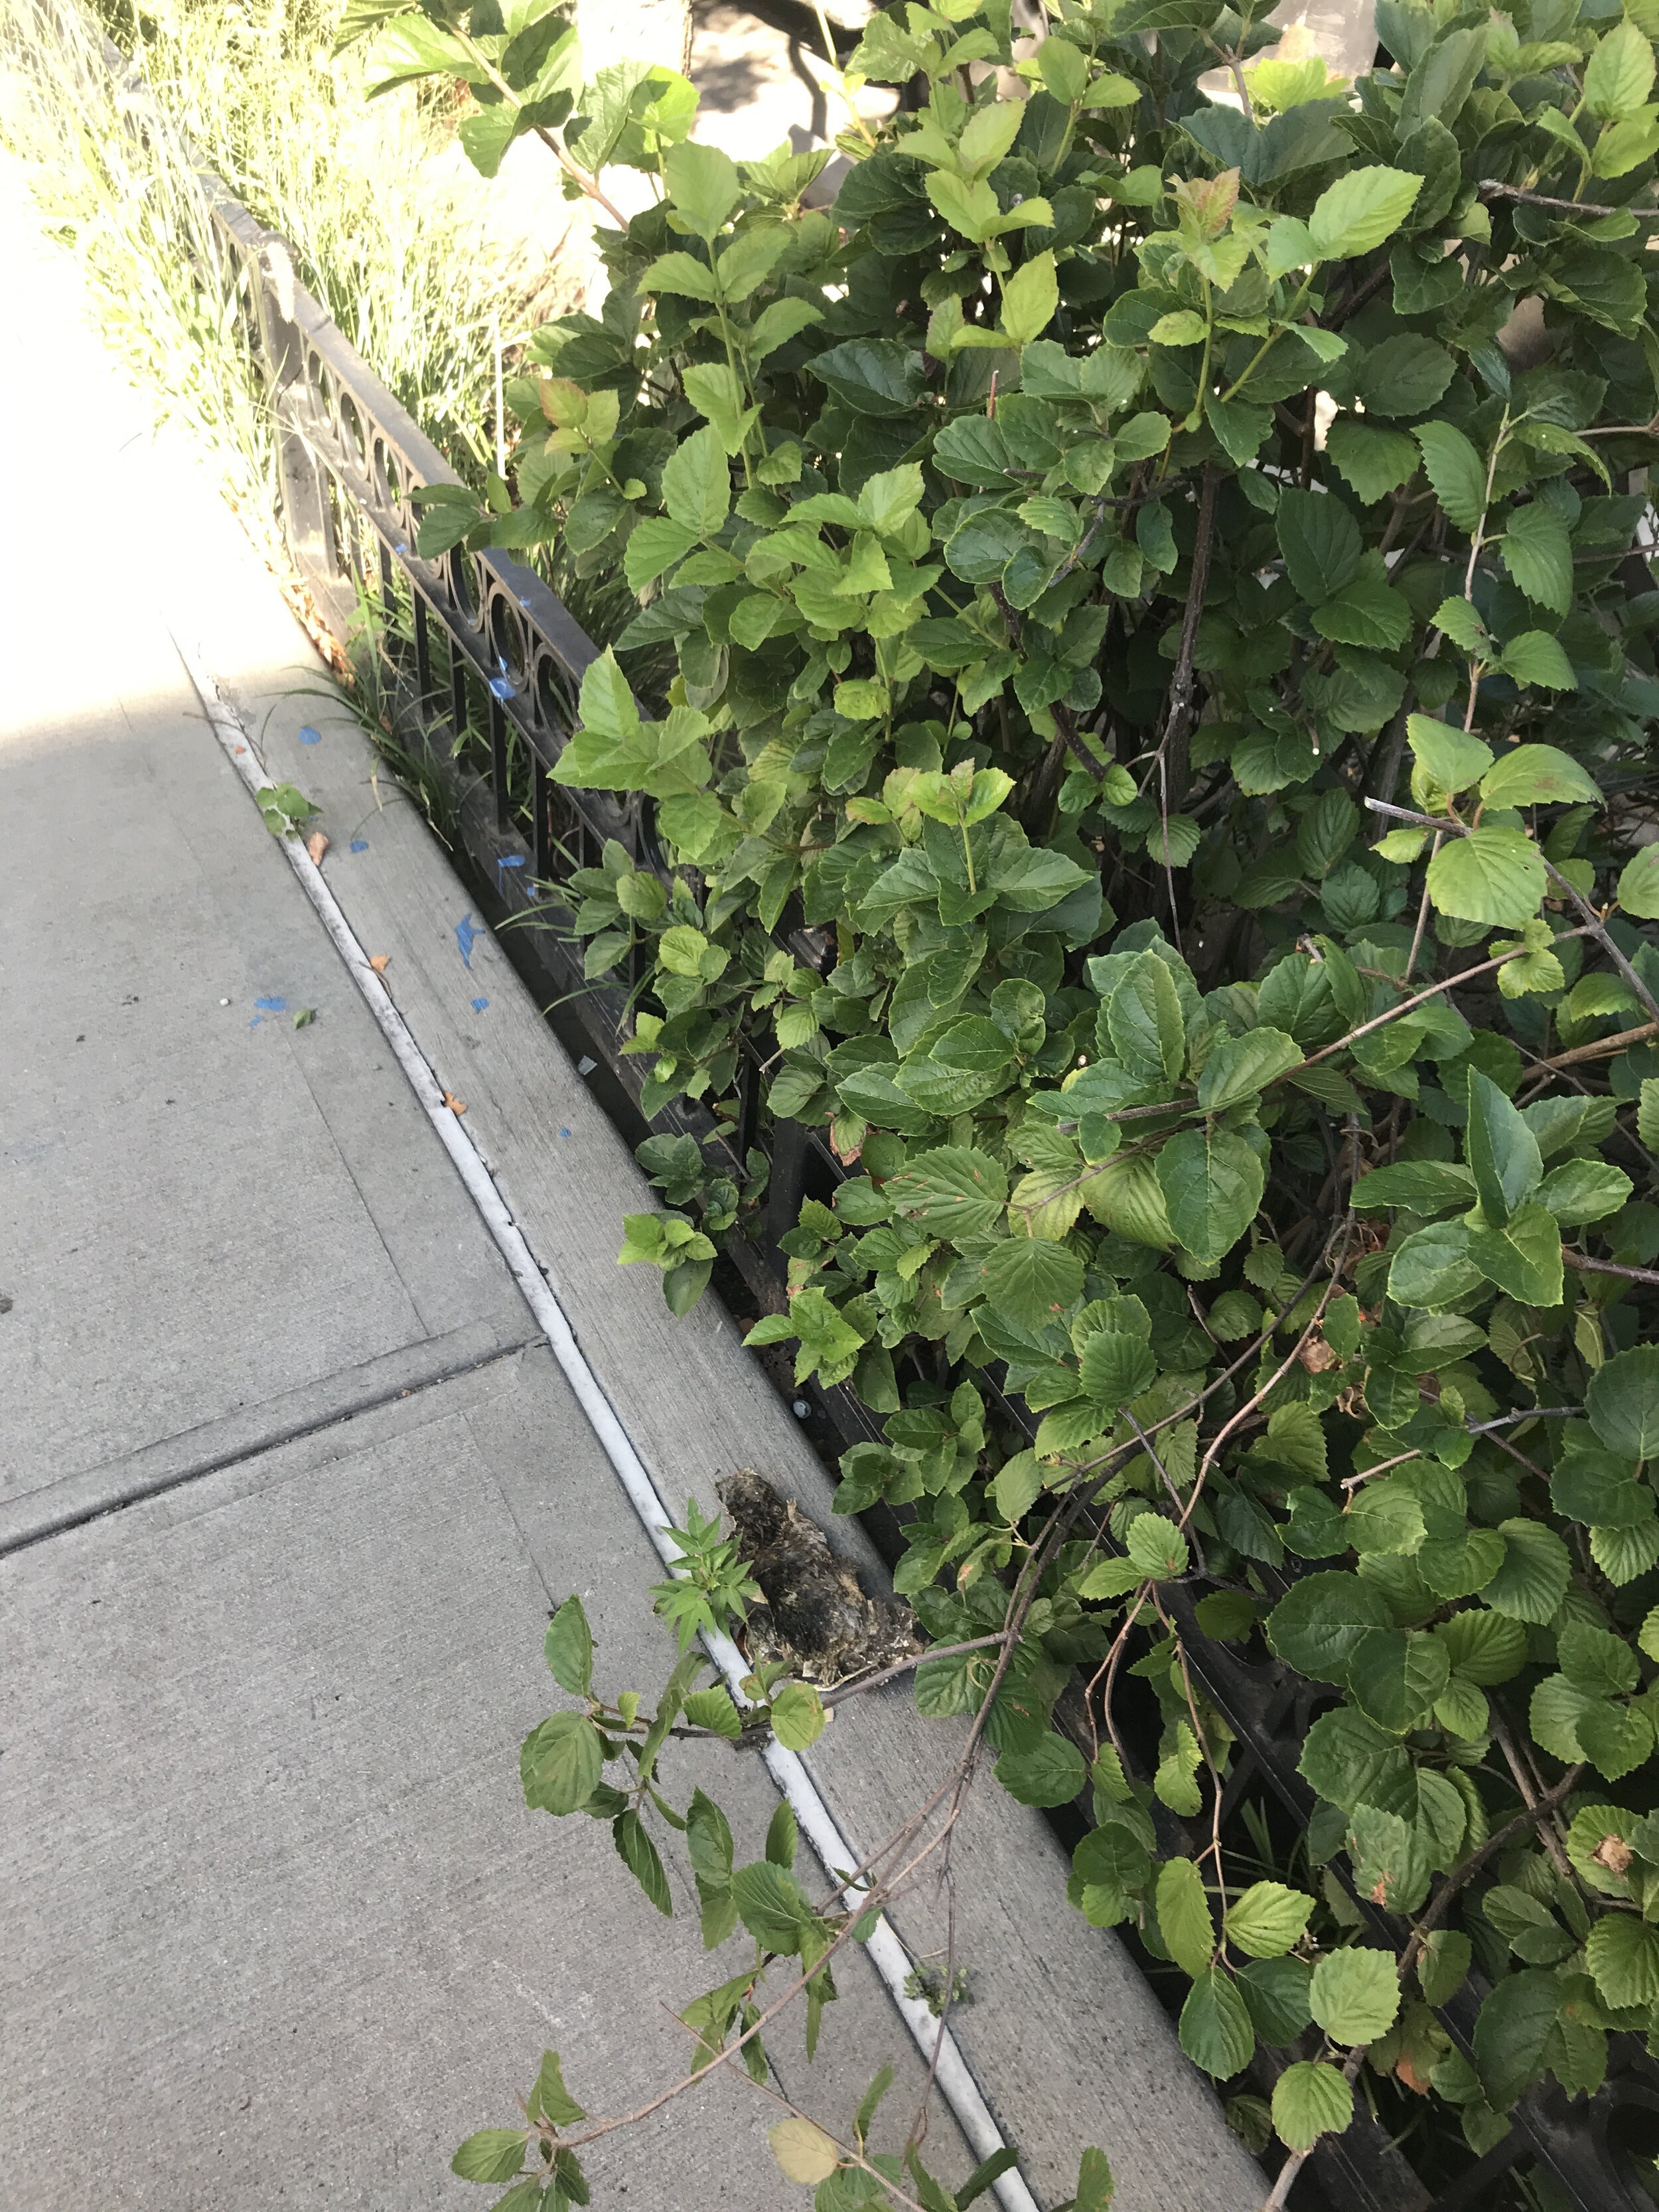
  • Petrified animal

  • By apartment + construction

  • Wide street

  • Someone added plant next to it?

  • Sewer down the street?

Stop 3

stop3.png


Site 5

  • Dekalb + Walworth

  • Under construction

  • Fences, dirt, need to plant

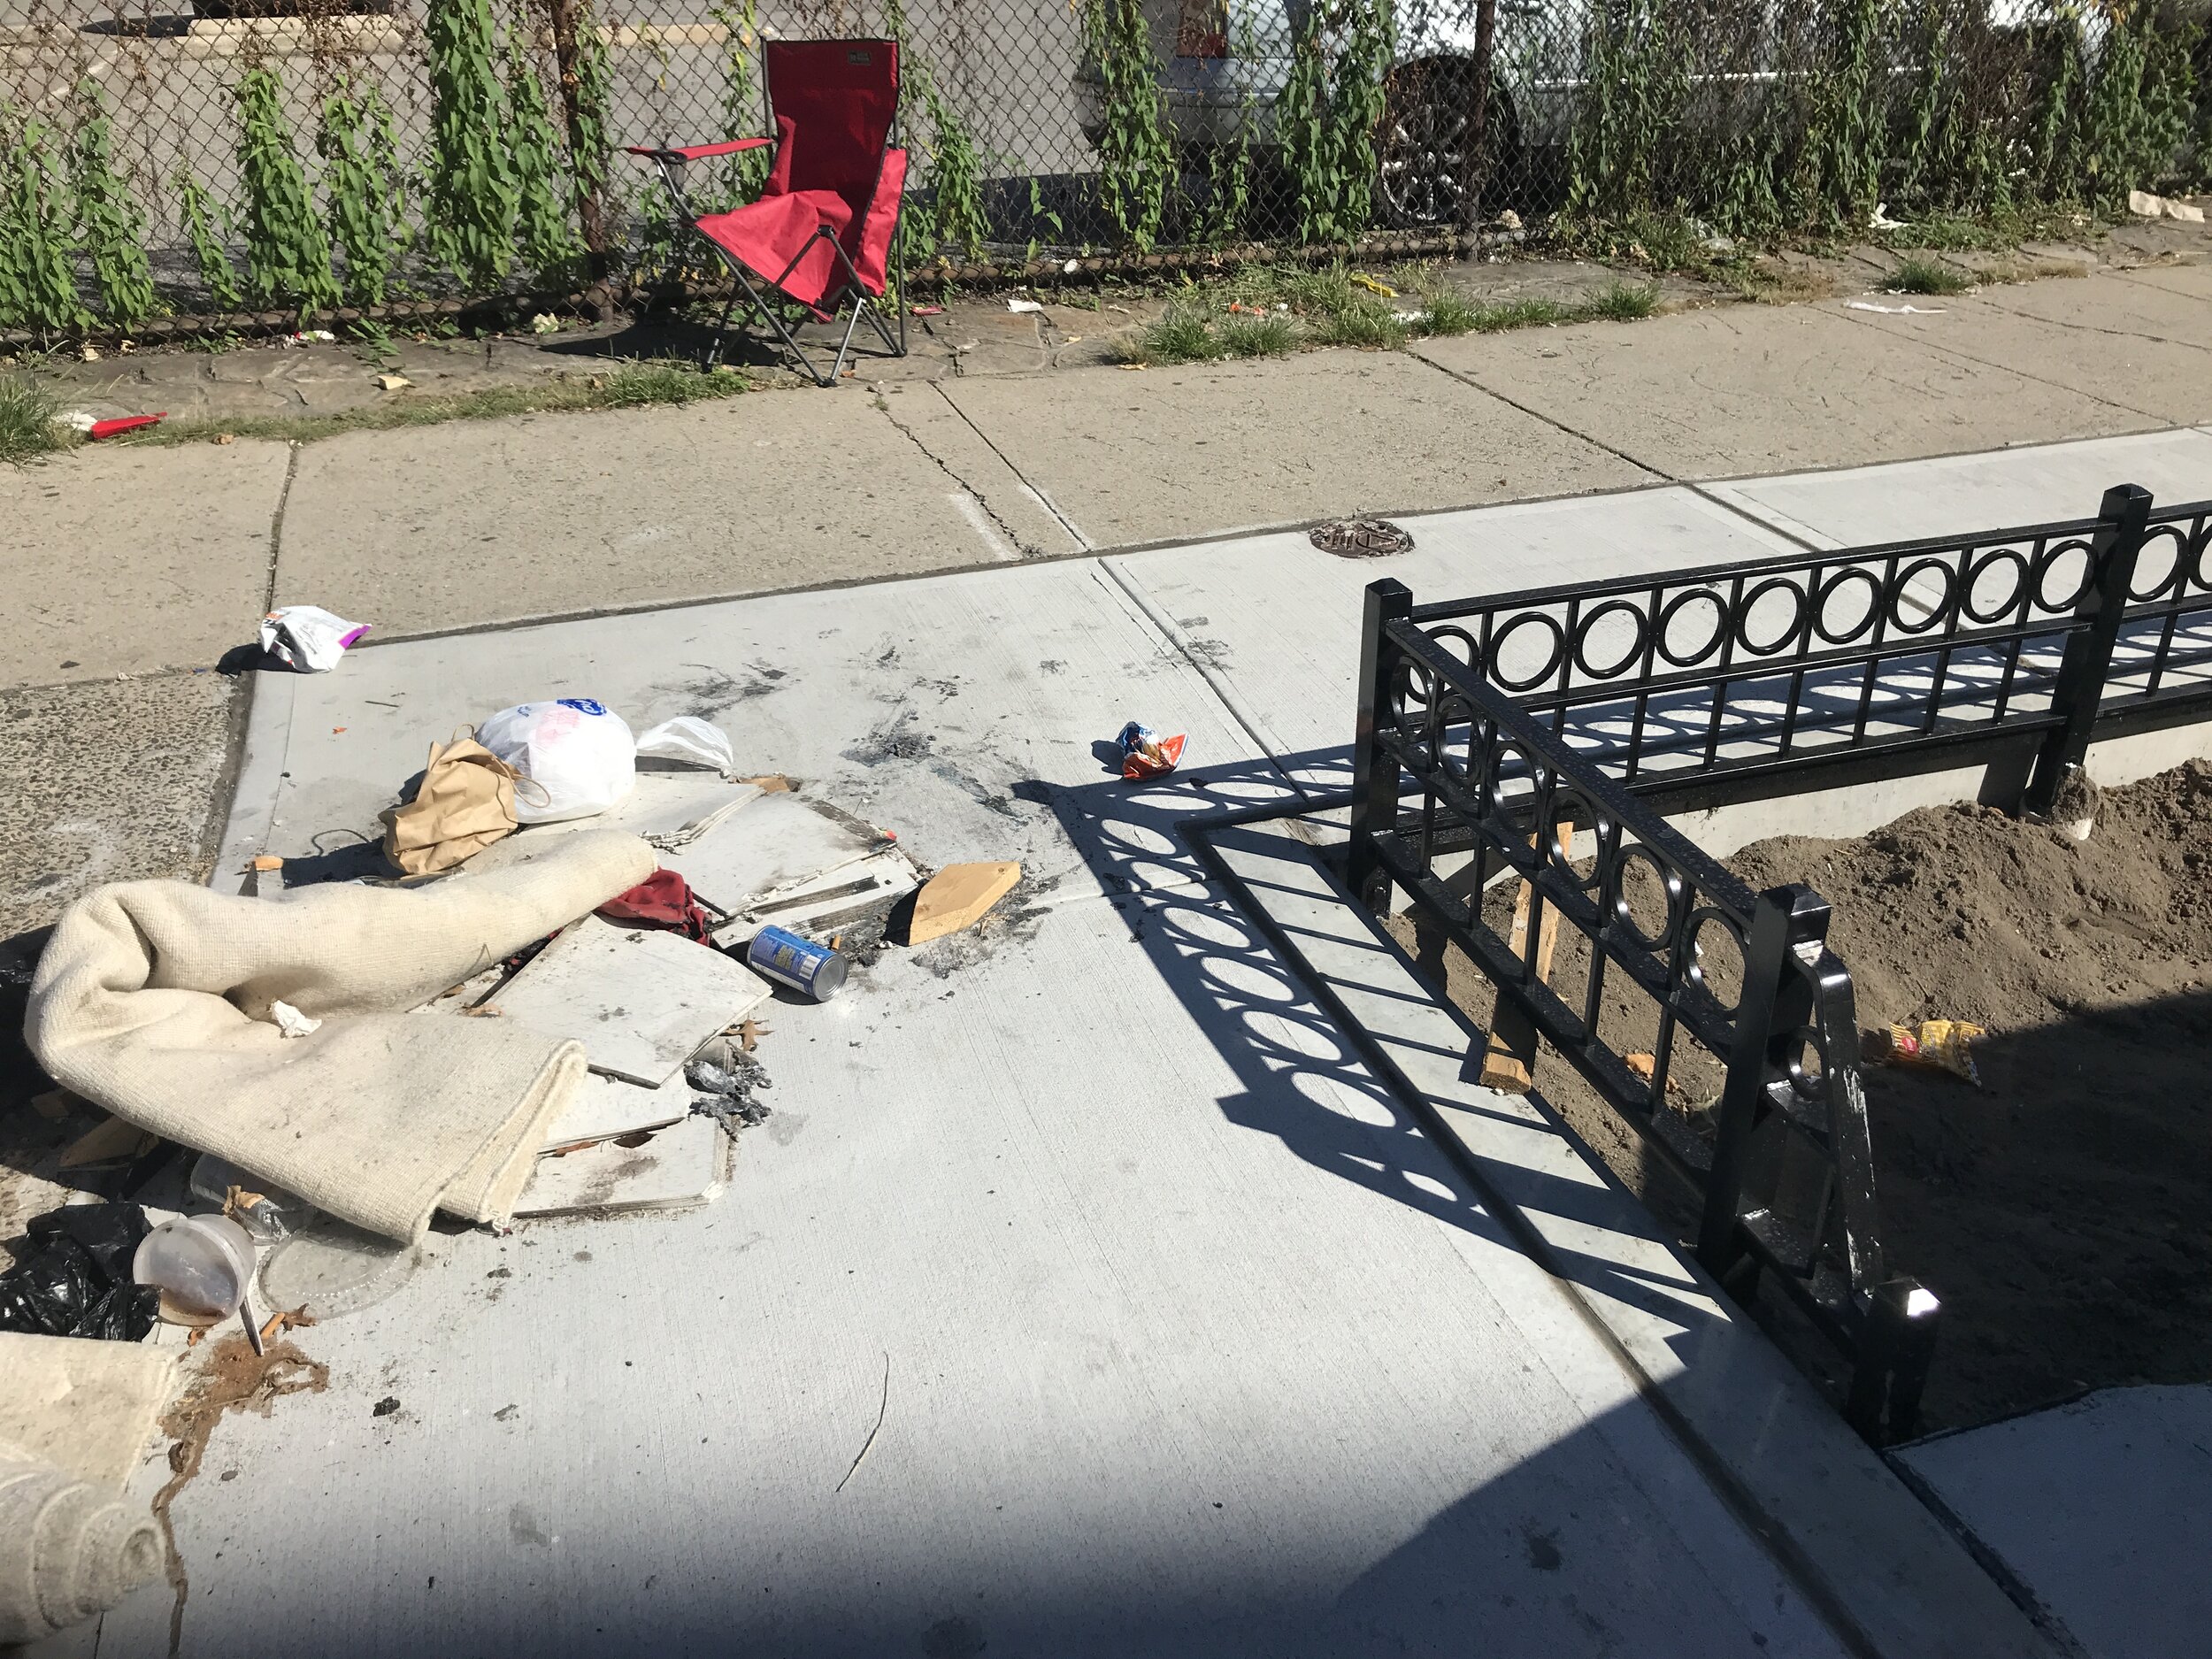
  • Some sand bags

  • By parking lot

  • Sewer at other end of street corner

  • Busy street

  • Trash lump nearby

Stop 4

stop4.png

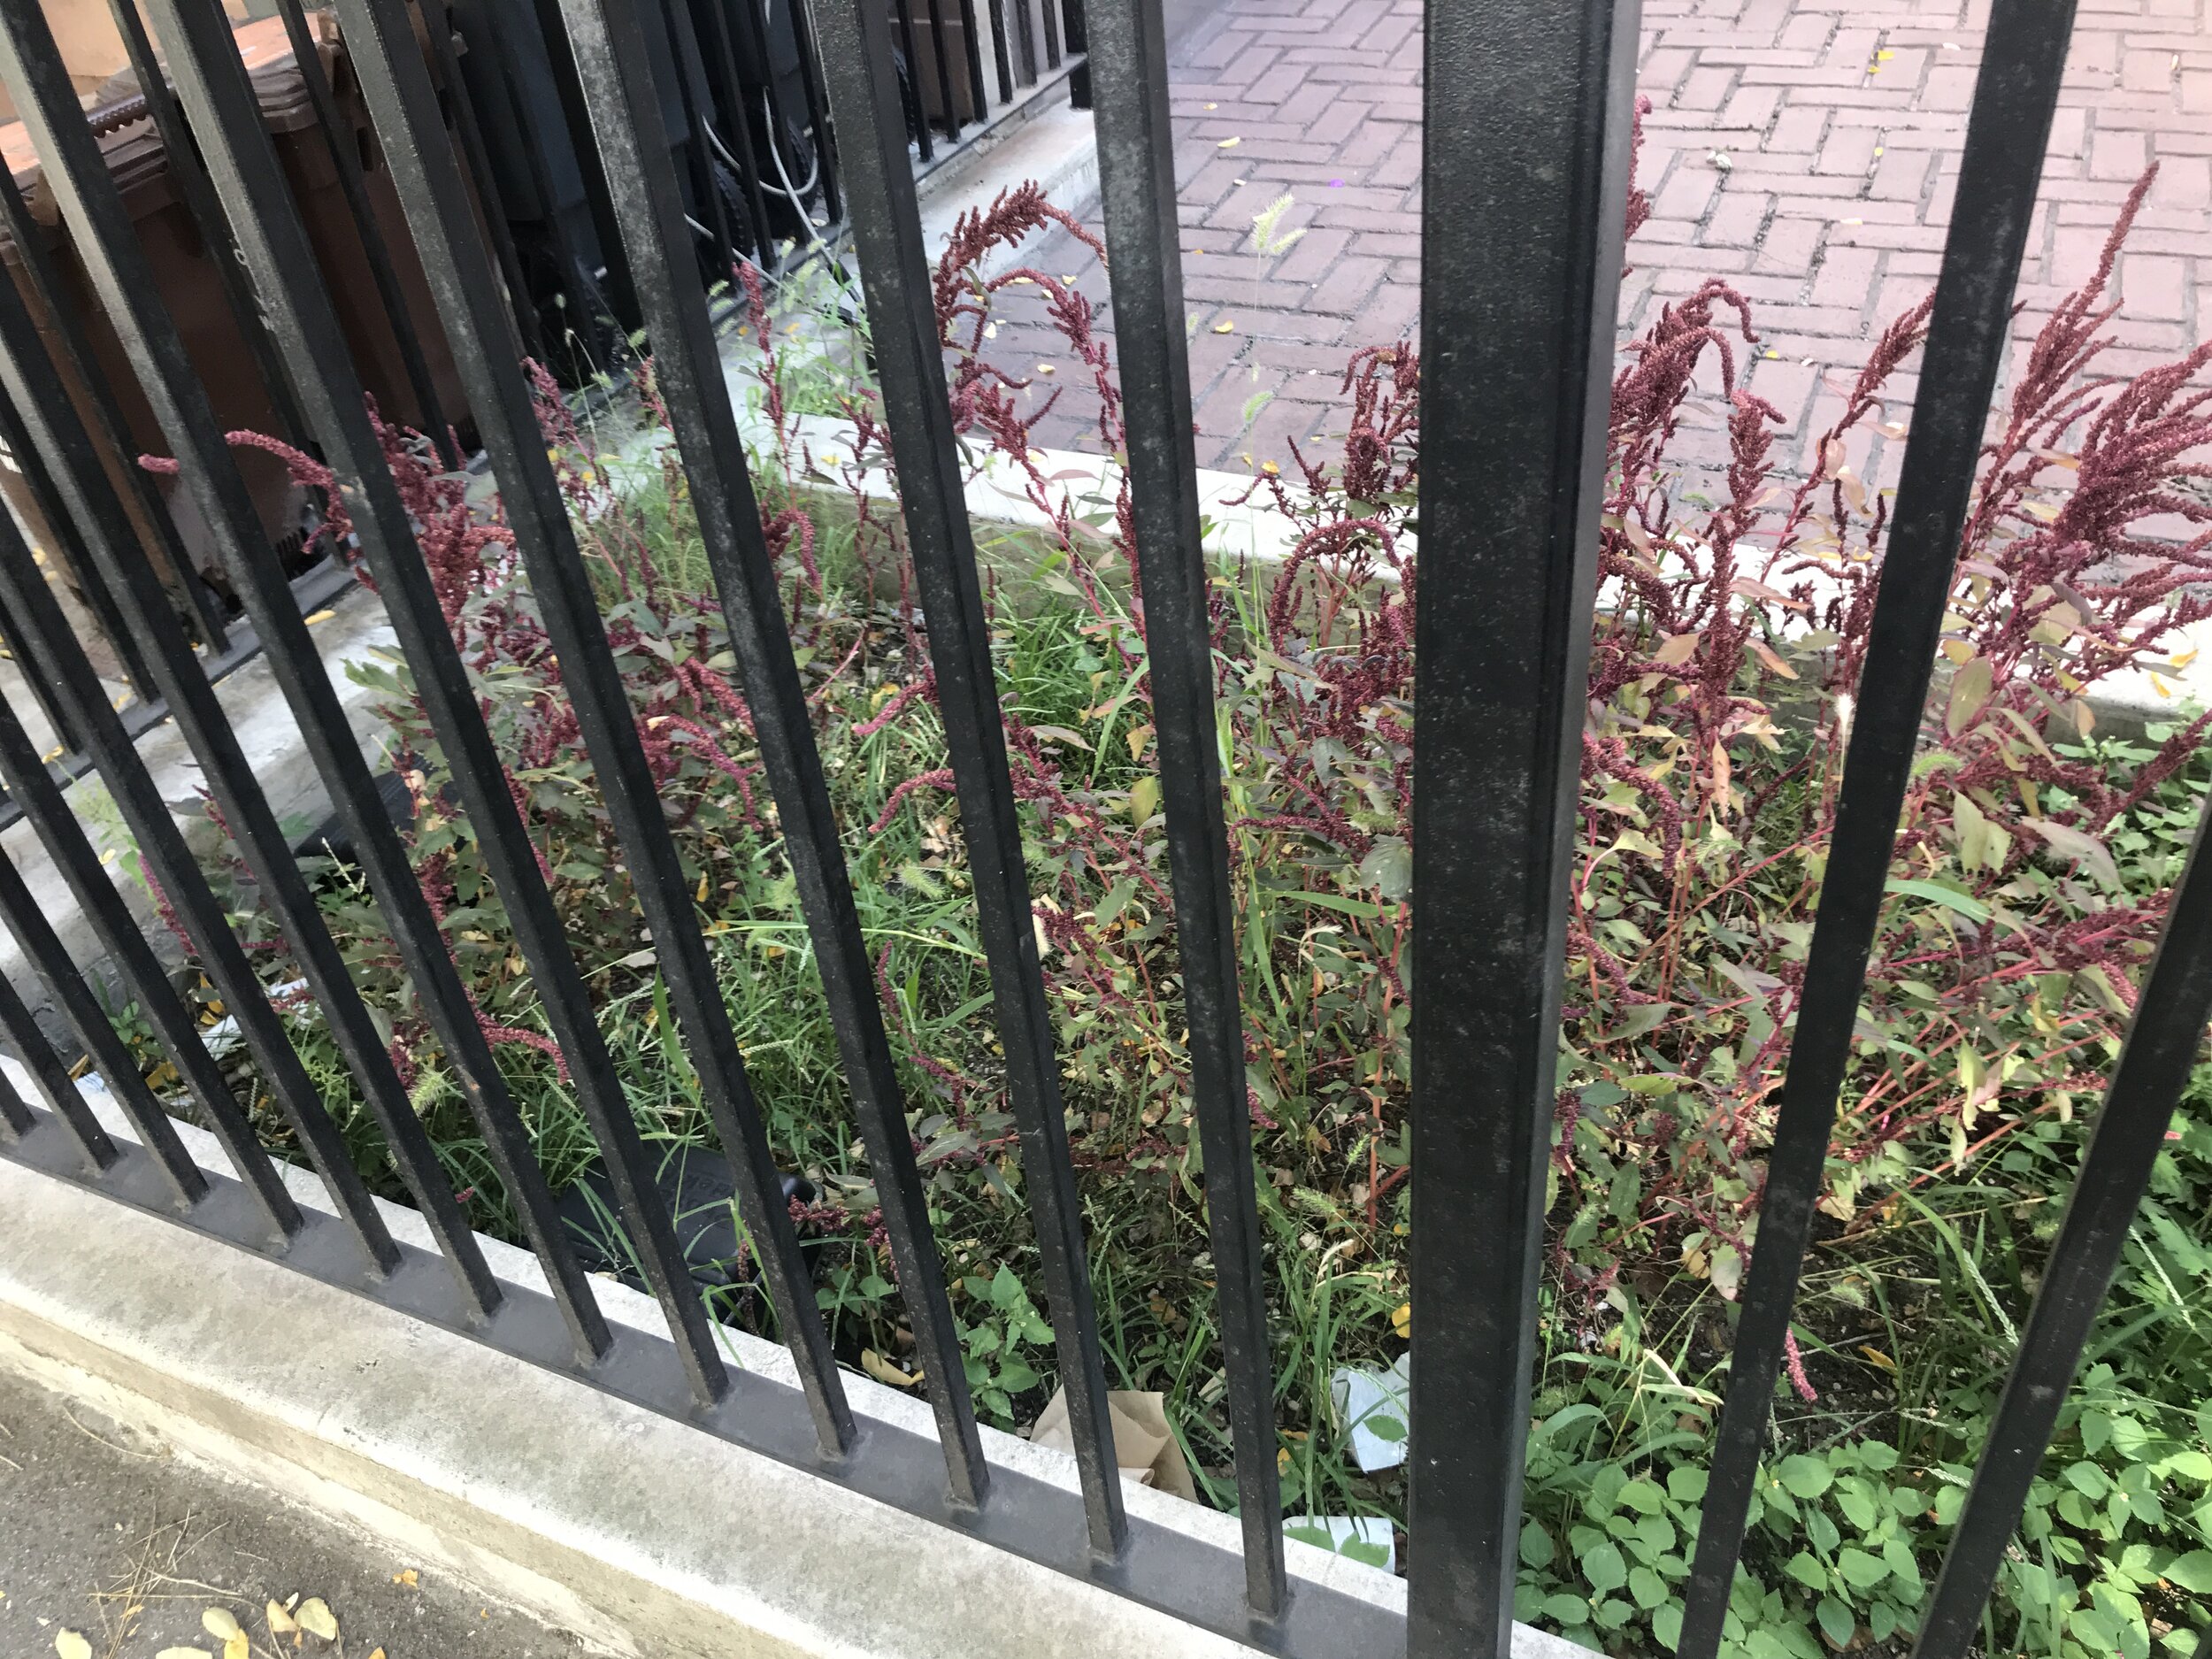
Site 6

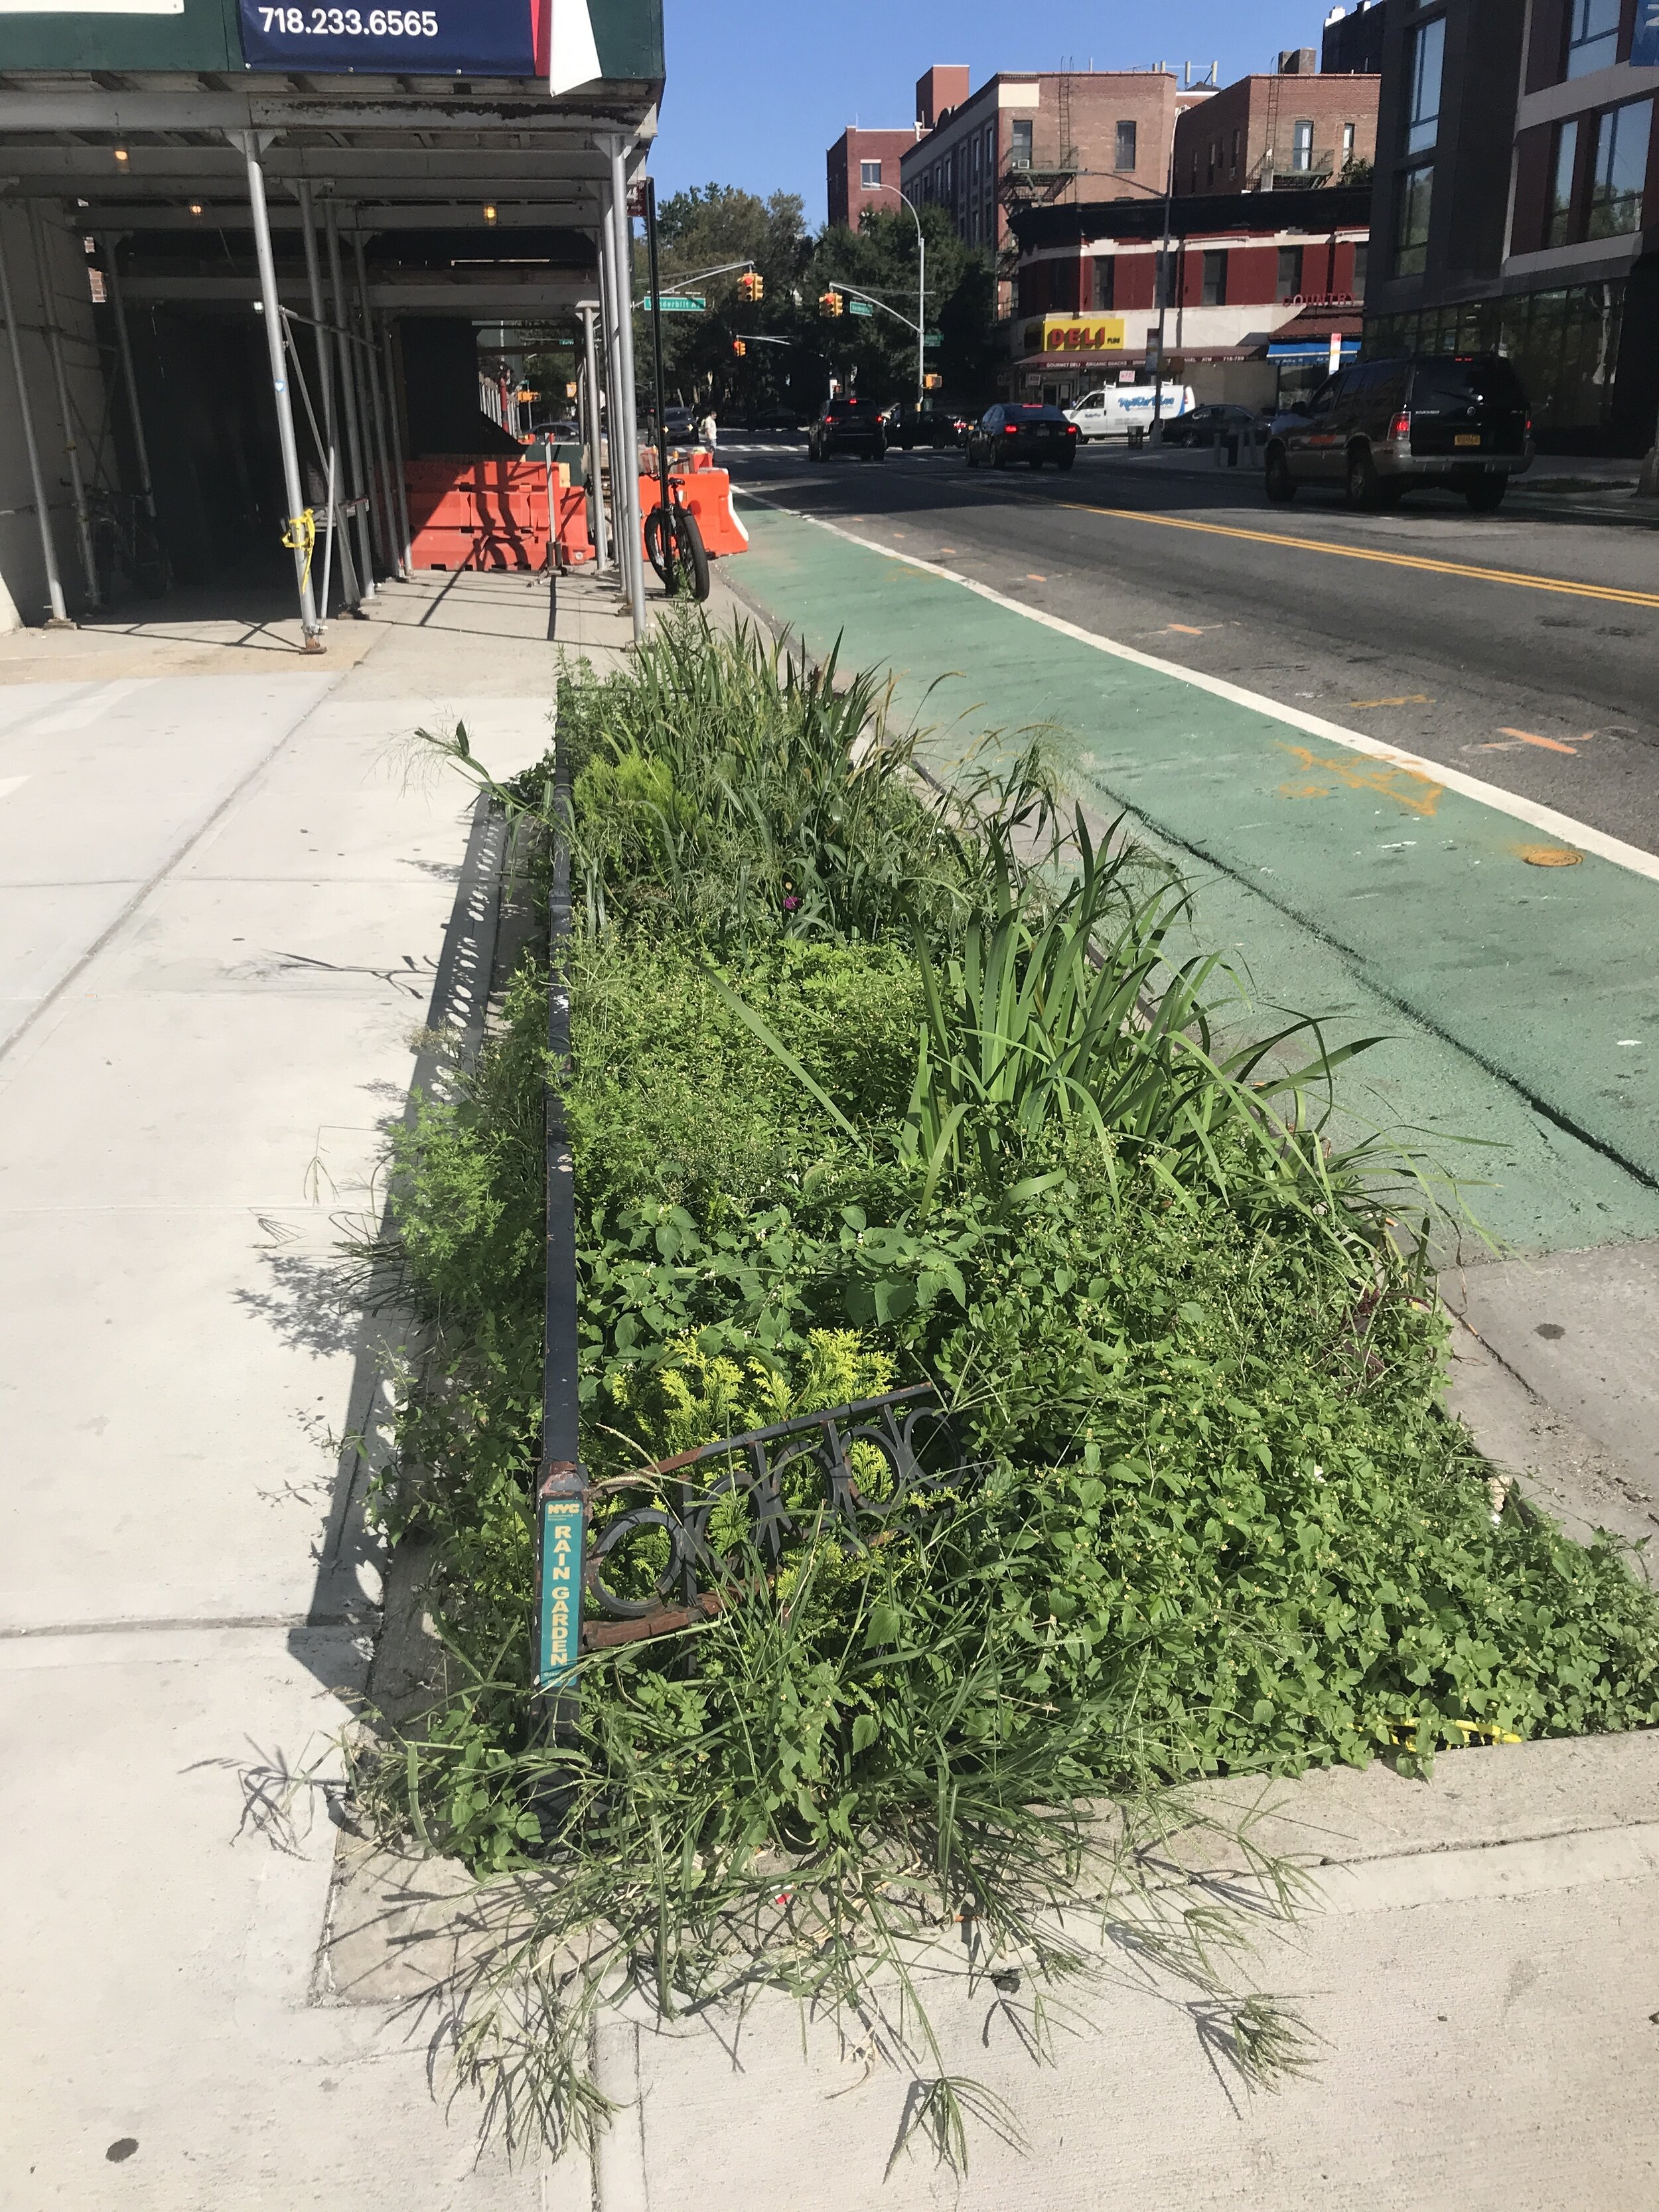
  • Overgrown

  • By bike lane

  • Saw someone come buy and pick up trash

  • Between fulton + atlantic

  • Lots of traffic + sirens

  • Flowers 

  • Some trash

  • Broken fence

  • New apartments

  • By job training site


Site 7

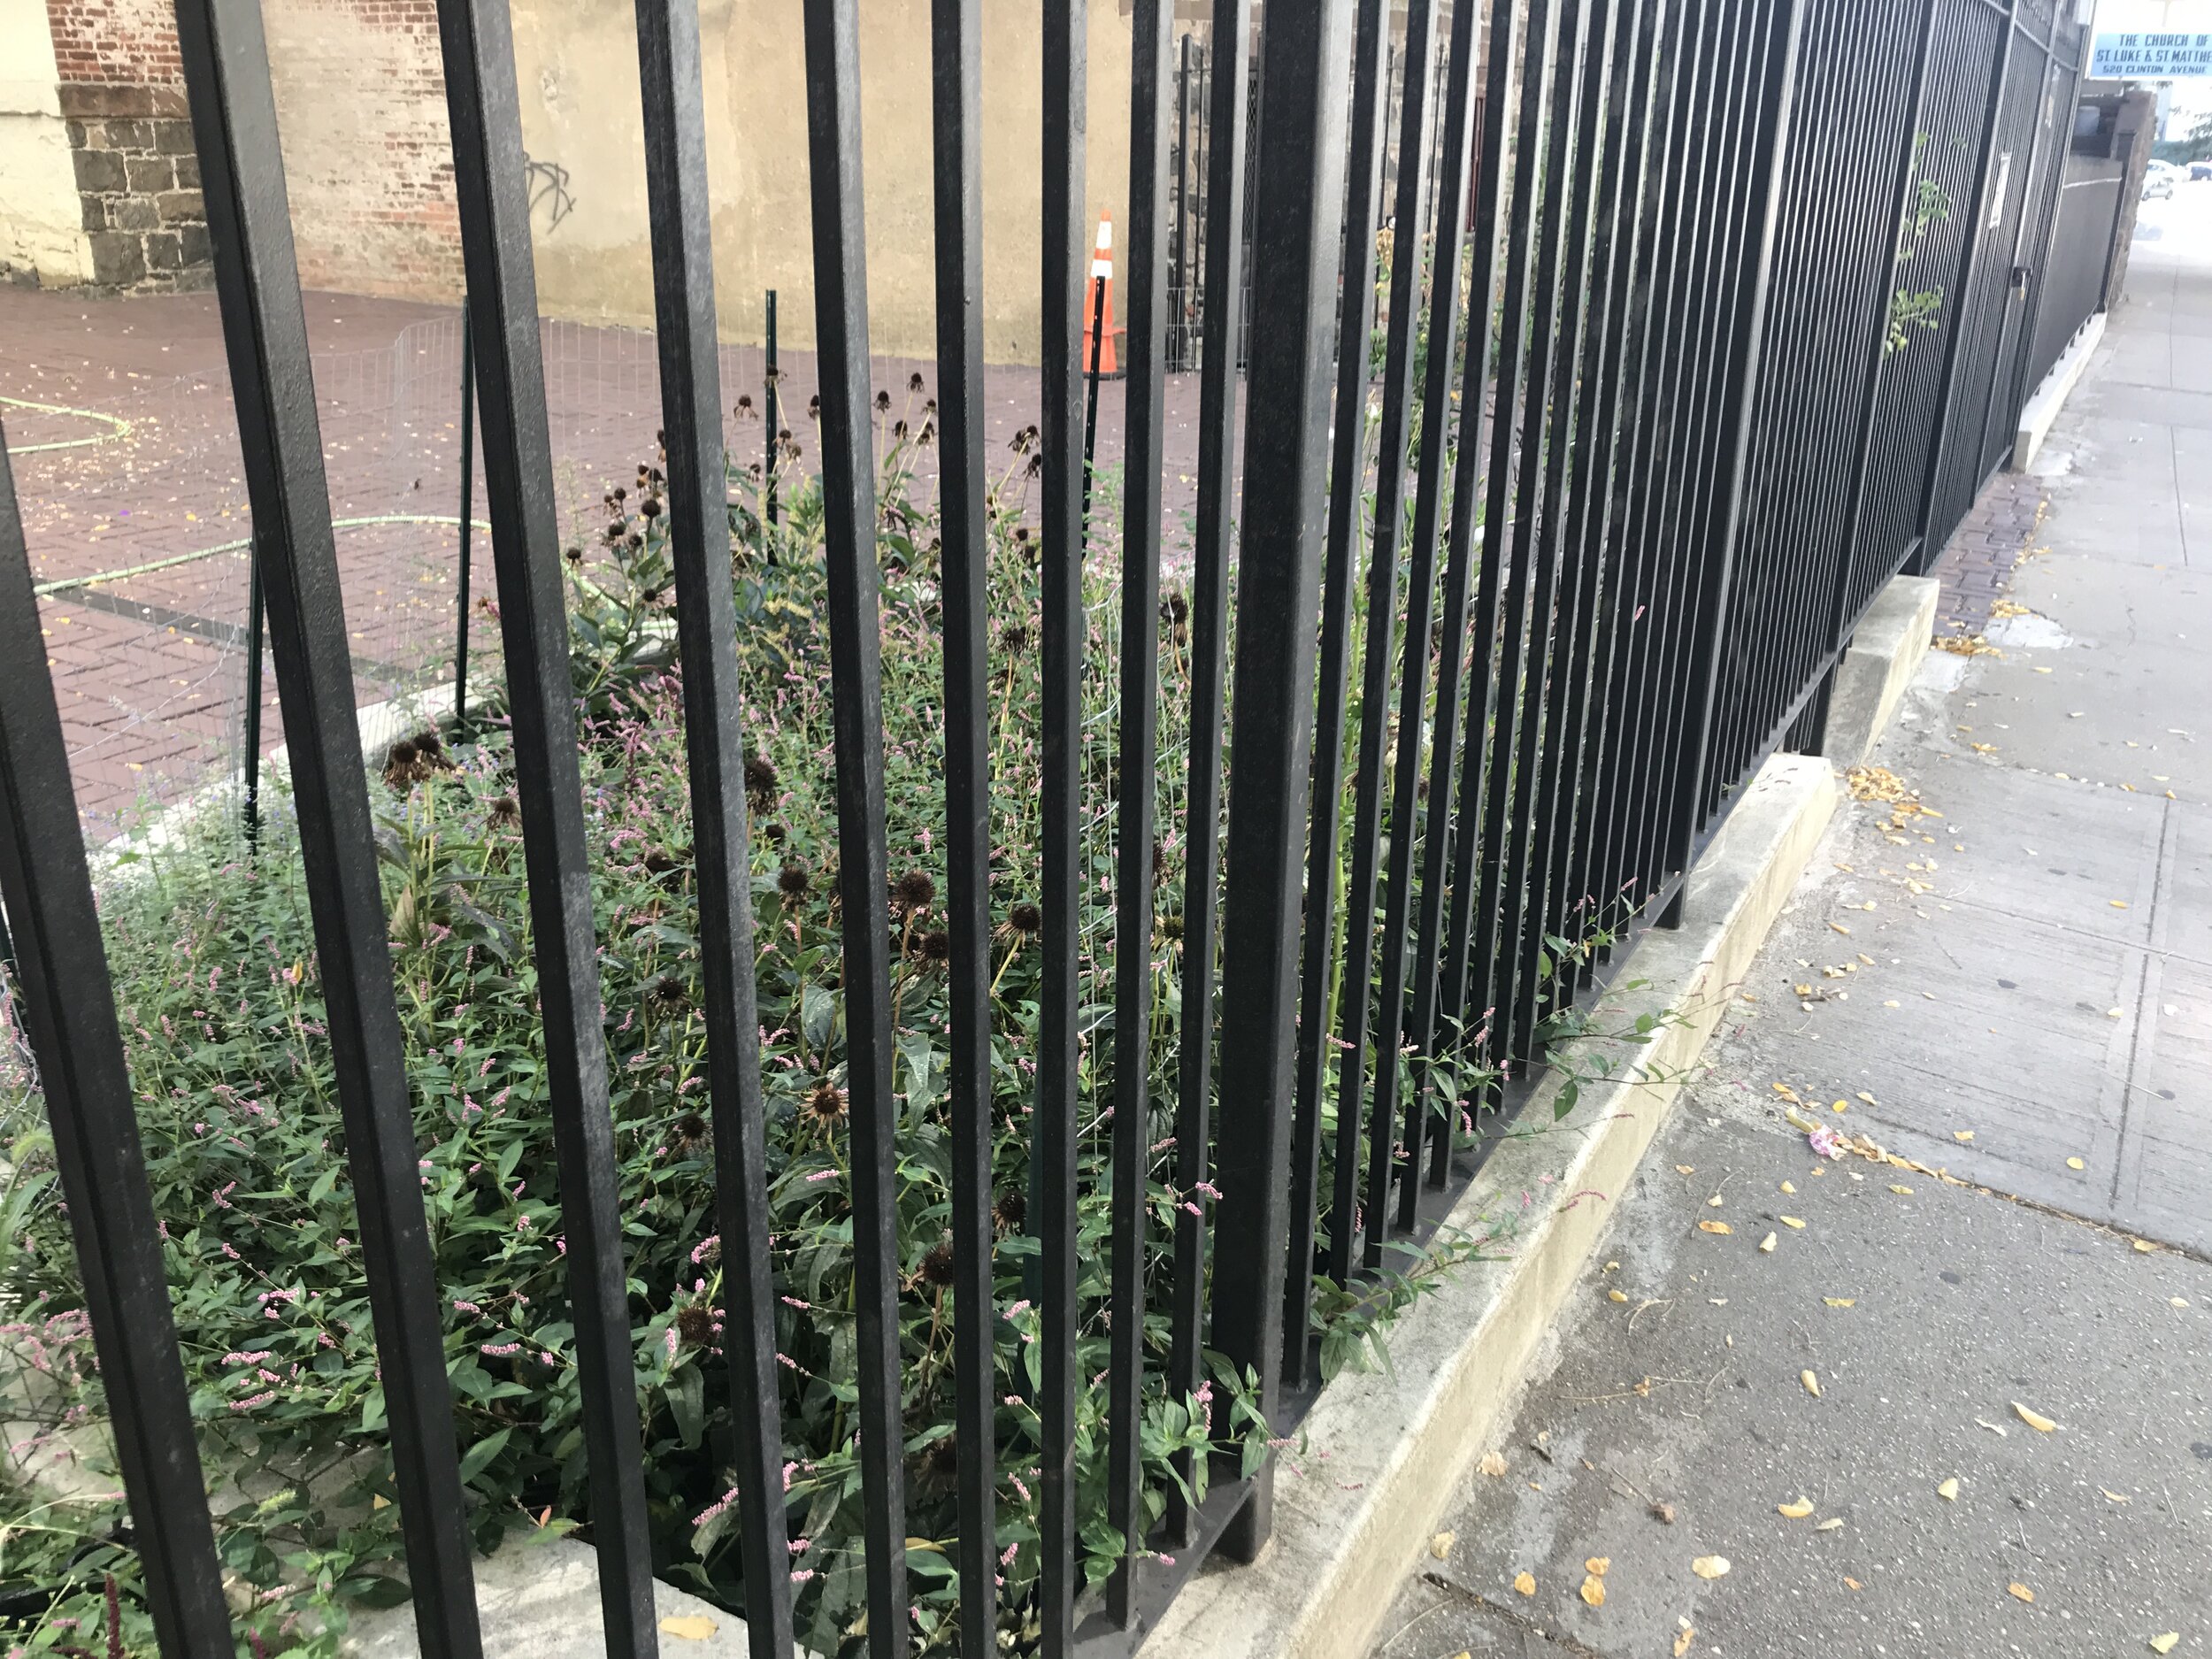
  • Church garden? On map looks like rain garden but I can’t find it

  • Behind a fence

  • Lots of flowers


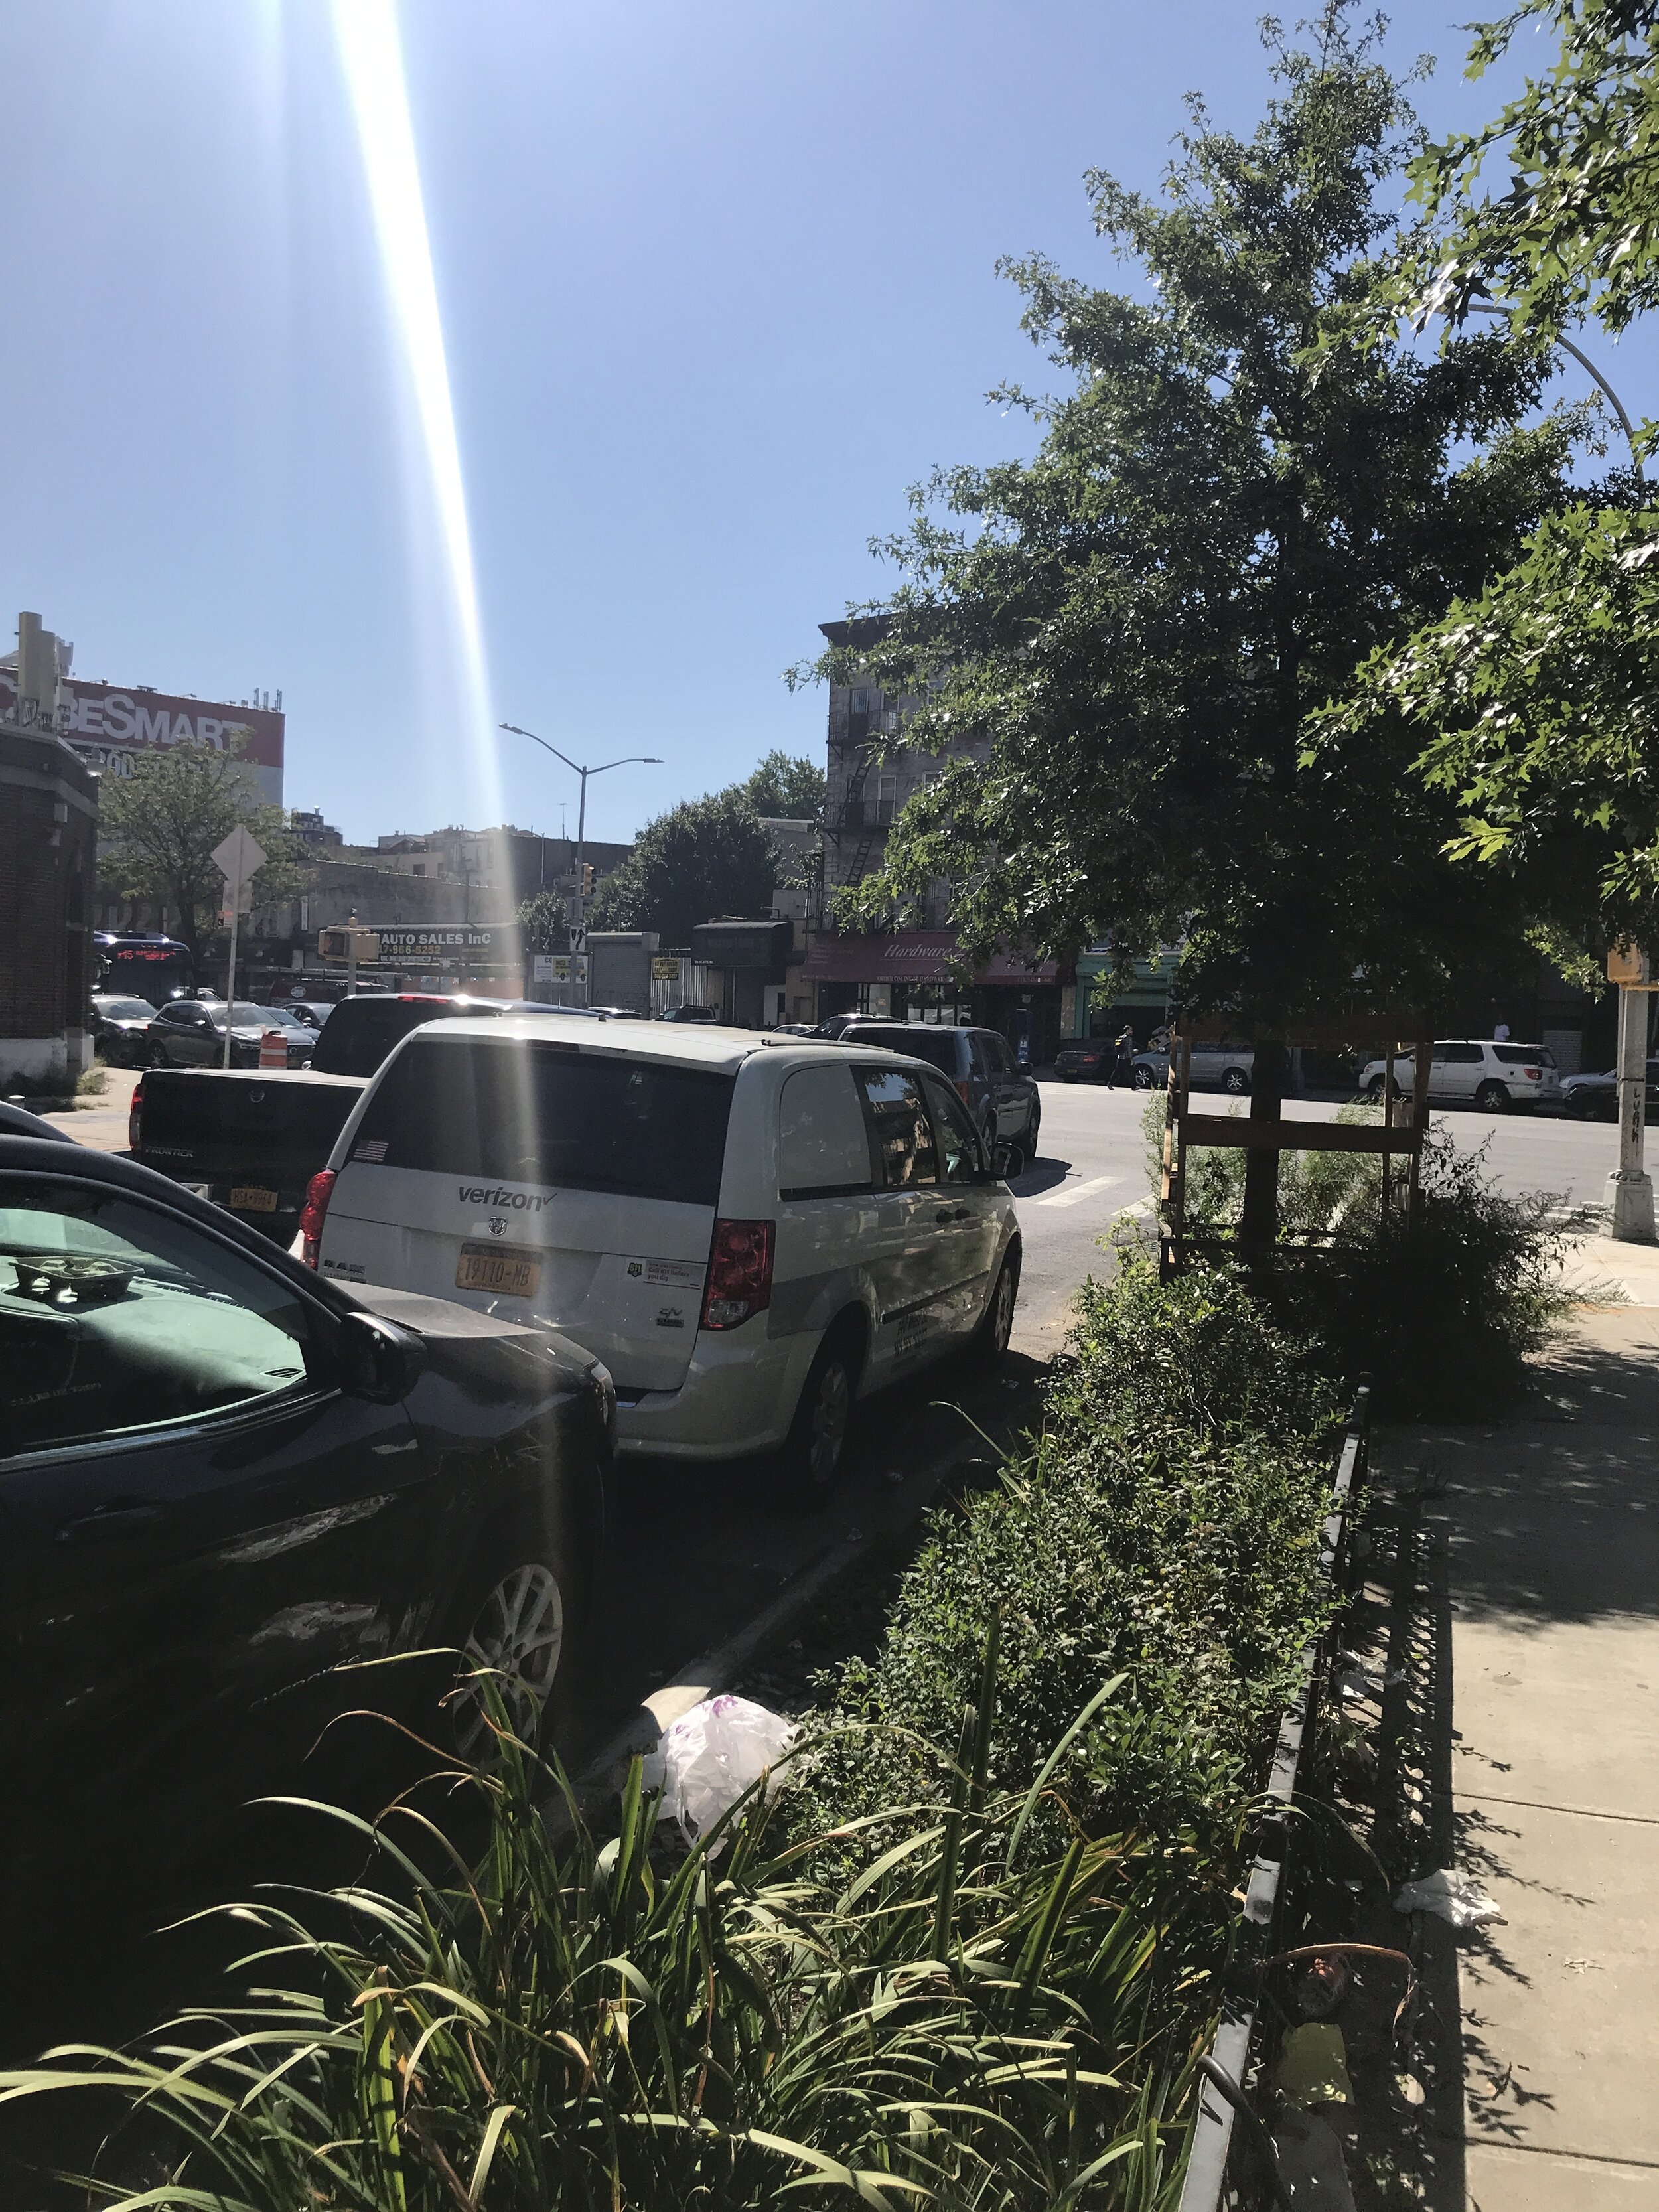
Site 8

  • Atlantic + clinton

  • Bushes, trash

  • By construction

  • Across from verizon

  • Busy

  • Near other trees

  • Sewer at corner

  • By clinton washington C stop

I also found some sites marked for construction: