This measuring device is designed to be used by a Garden Stewards to collect data on NYC Rain Gardens and post the data on the site, opening up a new relationship between the public, data and infrastructure.


Concept
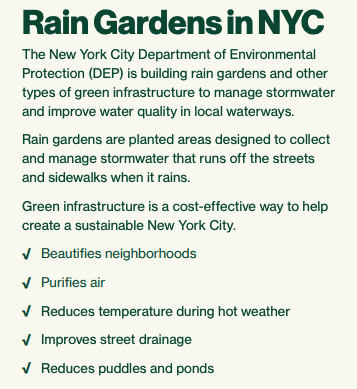
Rain Gardens (bioswales) are a form of green infrastructure built to improve street drainage, sewer system overflow and water quality in New York City waterways. They require extensive engineering to build and are actively maintained by the city and volunteer Garden Stewards. Anyone can apply to be a Garden Steward, and depending on the volunteer’s experience, the City provides training on how to perform simple maintenance a few times a month, carry out sediment removal and weeding, and organizing planting events.
What is striking about Rain Gardens is that they invisible infrastructure. Underneath their surface are imperceptible flows, a living spongy world made of dirt, rocks, gravel doing hidden work as part of a larger water ecosystem. One of the goals of the project is to unearth and bring to the surface what is underground. I have primarily done this by applying the ideas from Spongiform, an article by anthropologist Andrea Ballestero, to the NYC rain gardens context.
Like Ballestero’s aquifers, the presence of the rain garden fuzzes the the boundary between our lives and the NYC waterways. By acting as a permeable layer with multi-dimensional movement and flows, it destabilizes our conceptual model of the solid water system made of concrete, gutters and pipes.
In this project I ask: how could this device...
Expand the boundary around citizenship to include maintenance of systems?
Make inputs and outputs explicit in order to re-draw the boundary of the Rain Garden?
This project addresses these questions by making the rain garden data part of the visible aspects of the infrastructure. How does this type of intervention adjust our volumetric understandings of what is below our feet and how we are connected to New York City water ecosystem? My hope is that this project prompts the passerby to acknowledge that both they and the rain garden are actors in the same system.
Device
In the context of the larger water system, I wanted to make the passerby connect the dots between the different actors and blur their previously conceived boundaries in order to reconfigure the Rain Garden data in a meaningful way. The rain garden data is normally separate from the physical garden, usually located in an open data portal or report produced by the city. This project aims to make it part of the Rain Garden form itself. This project asks: in what ways is the rain garden a manifestation of the data? In what ways is the data a manifestation of the rain garden?
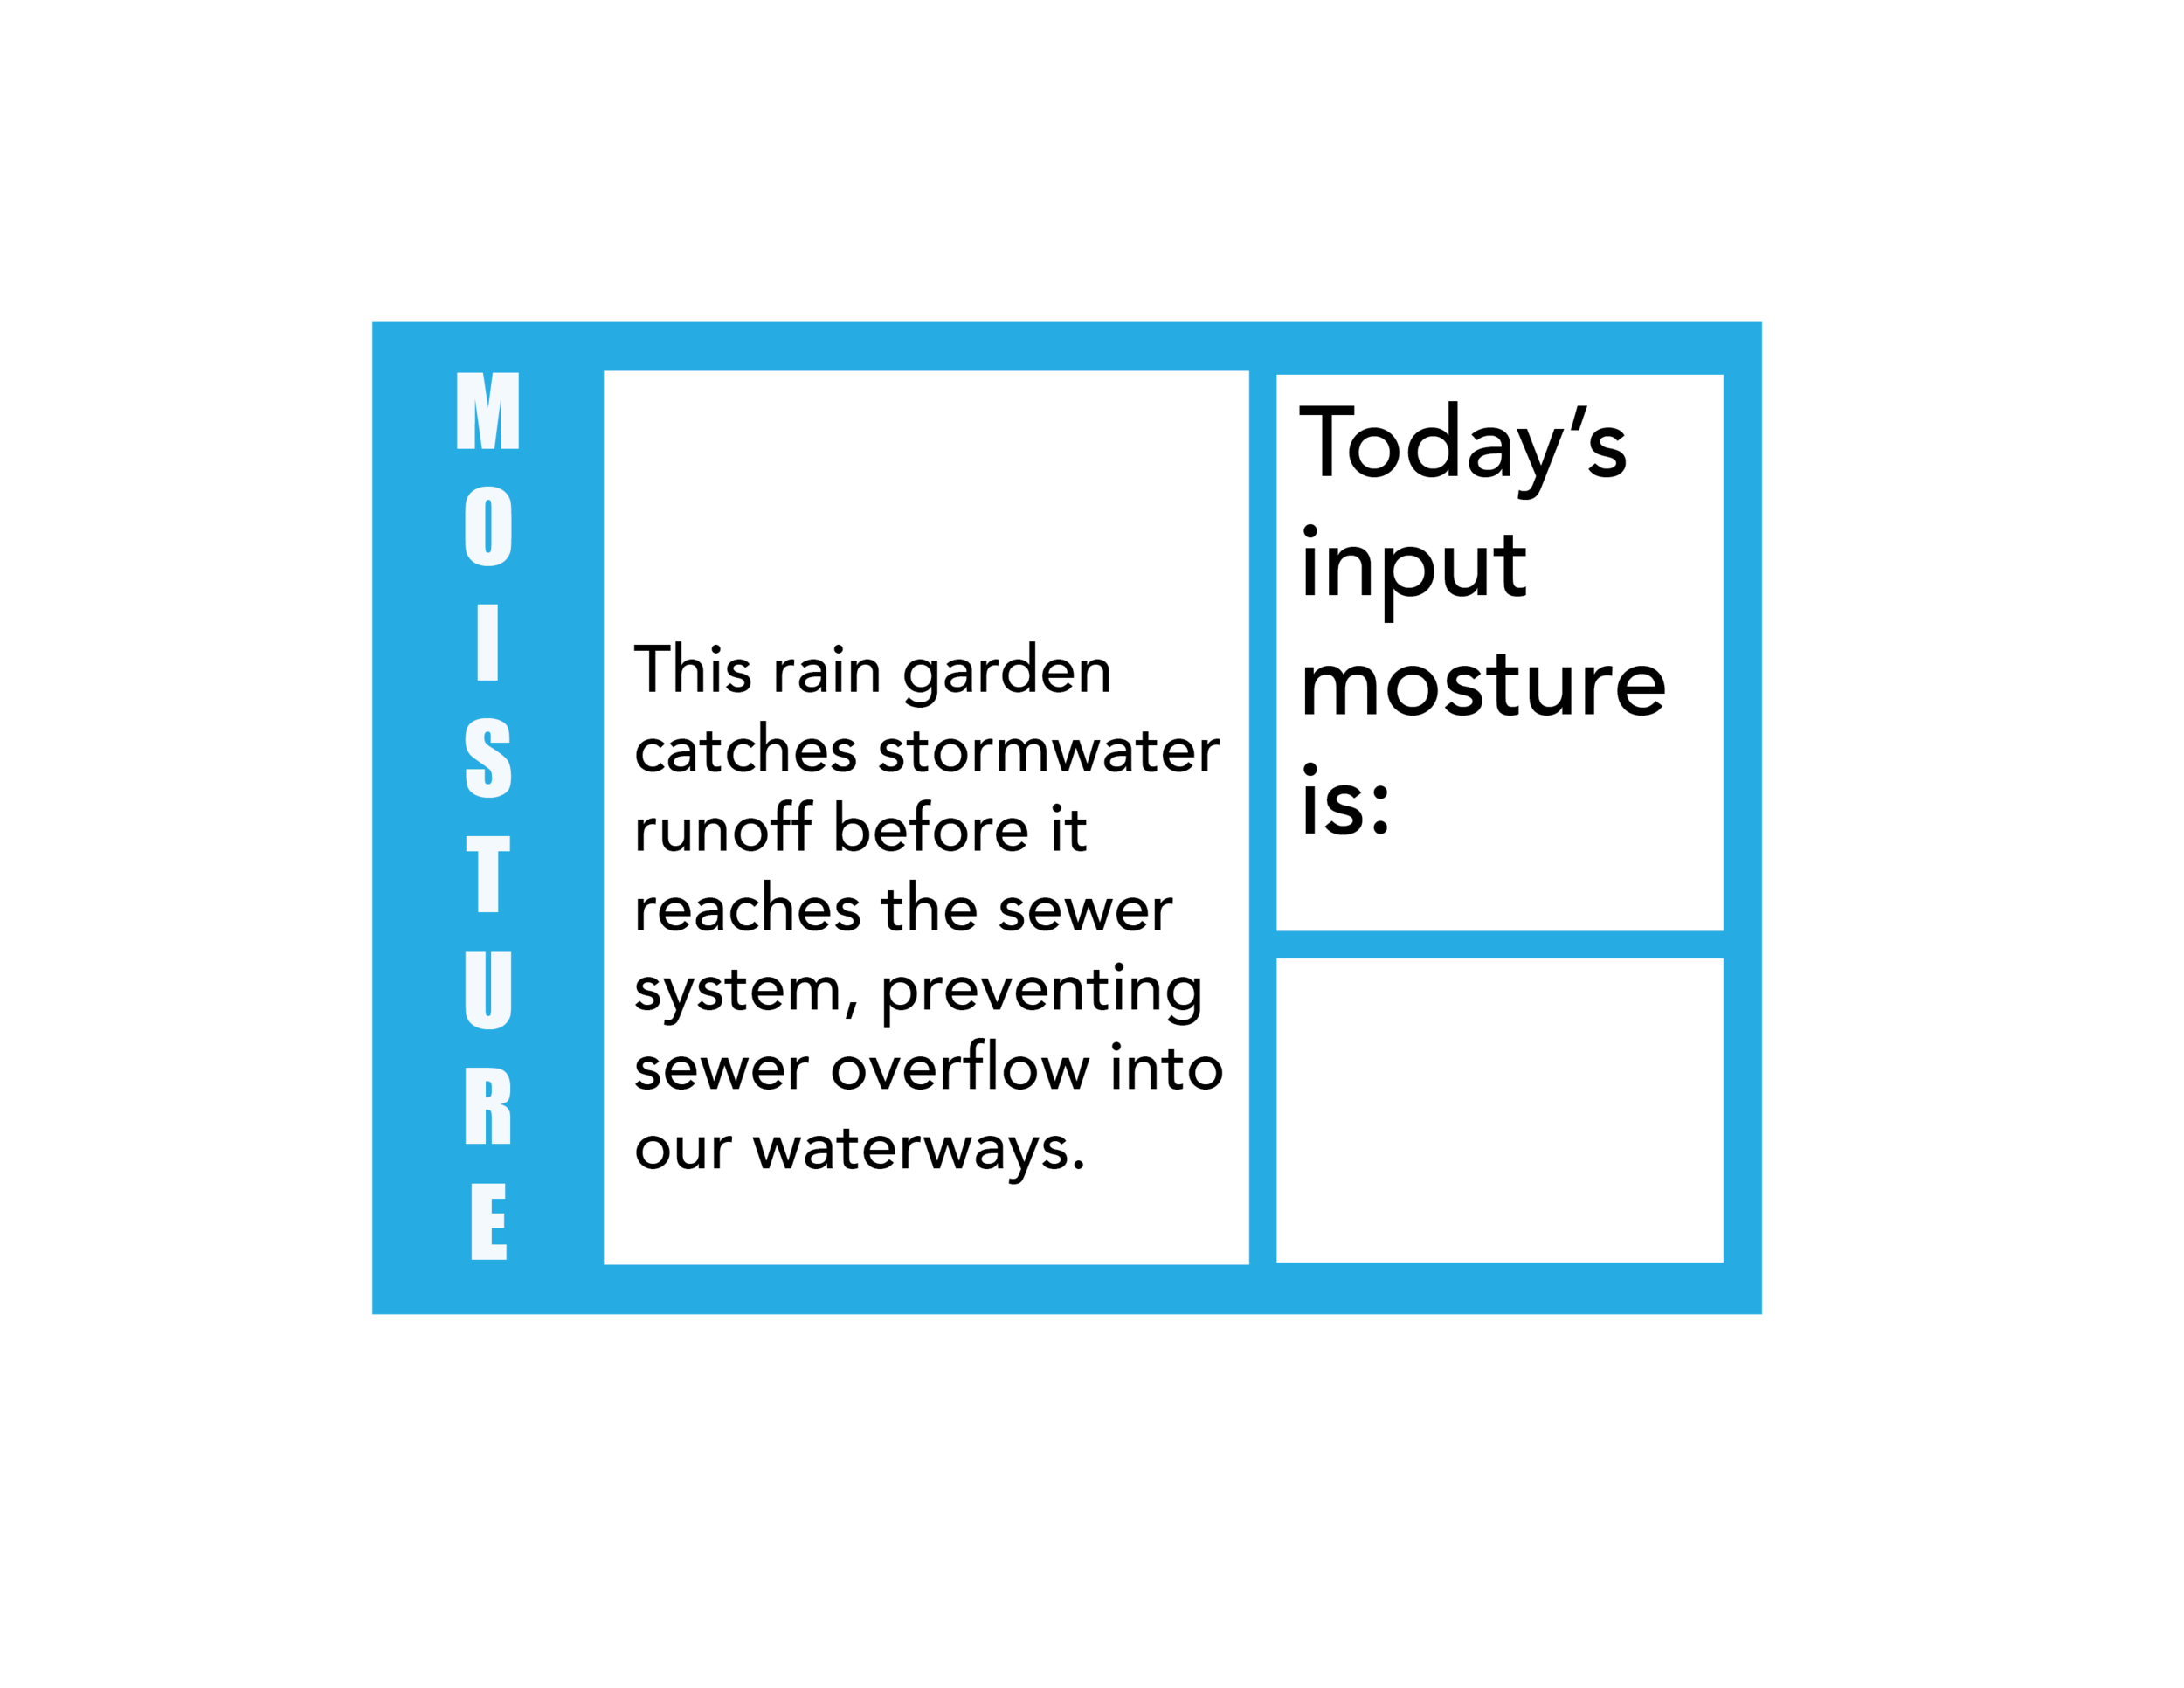
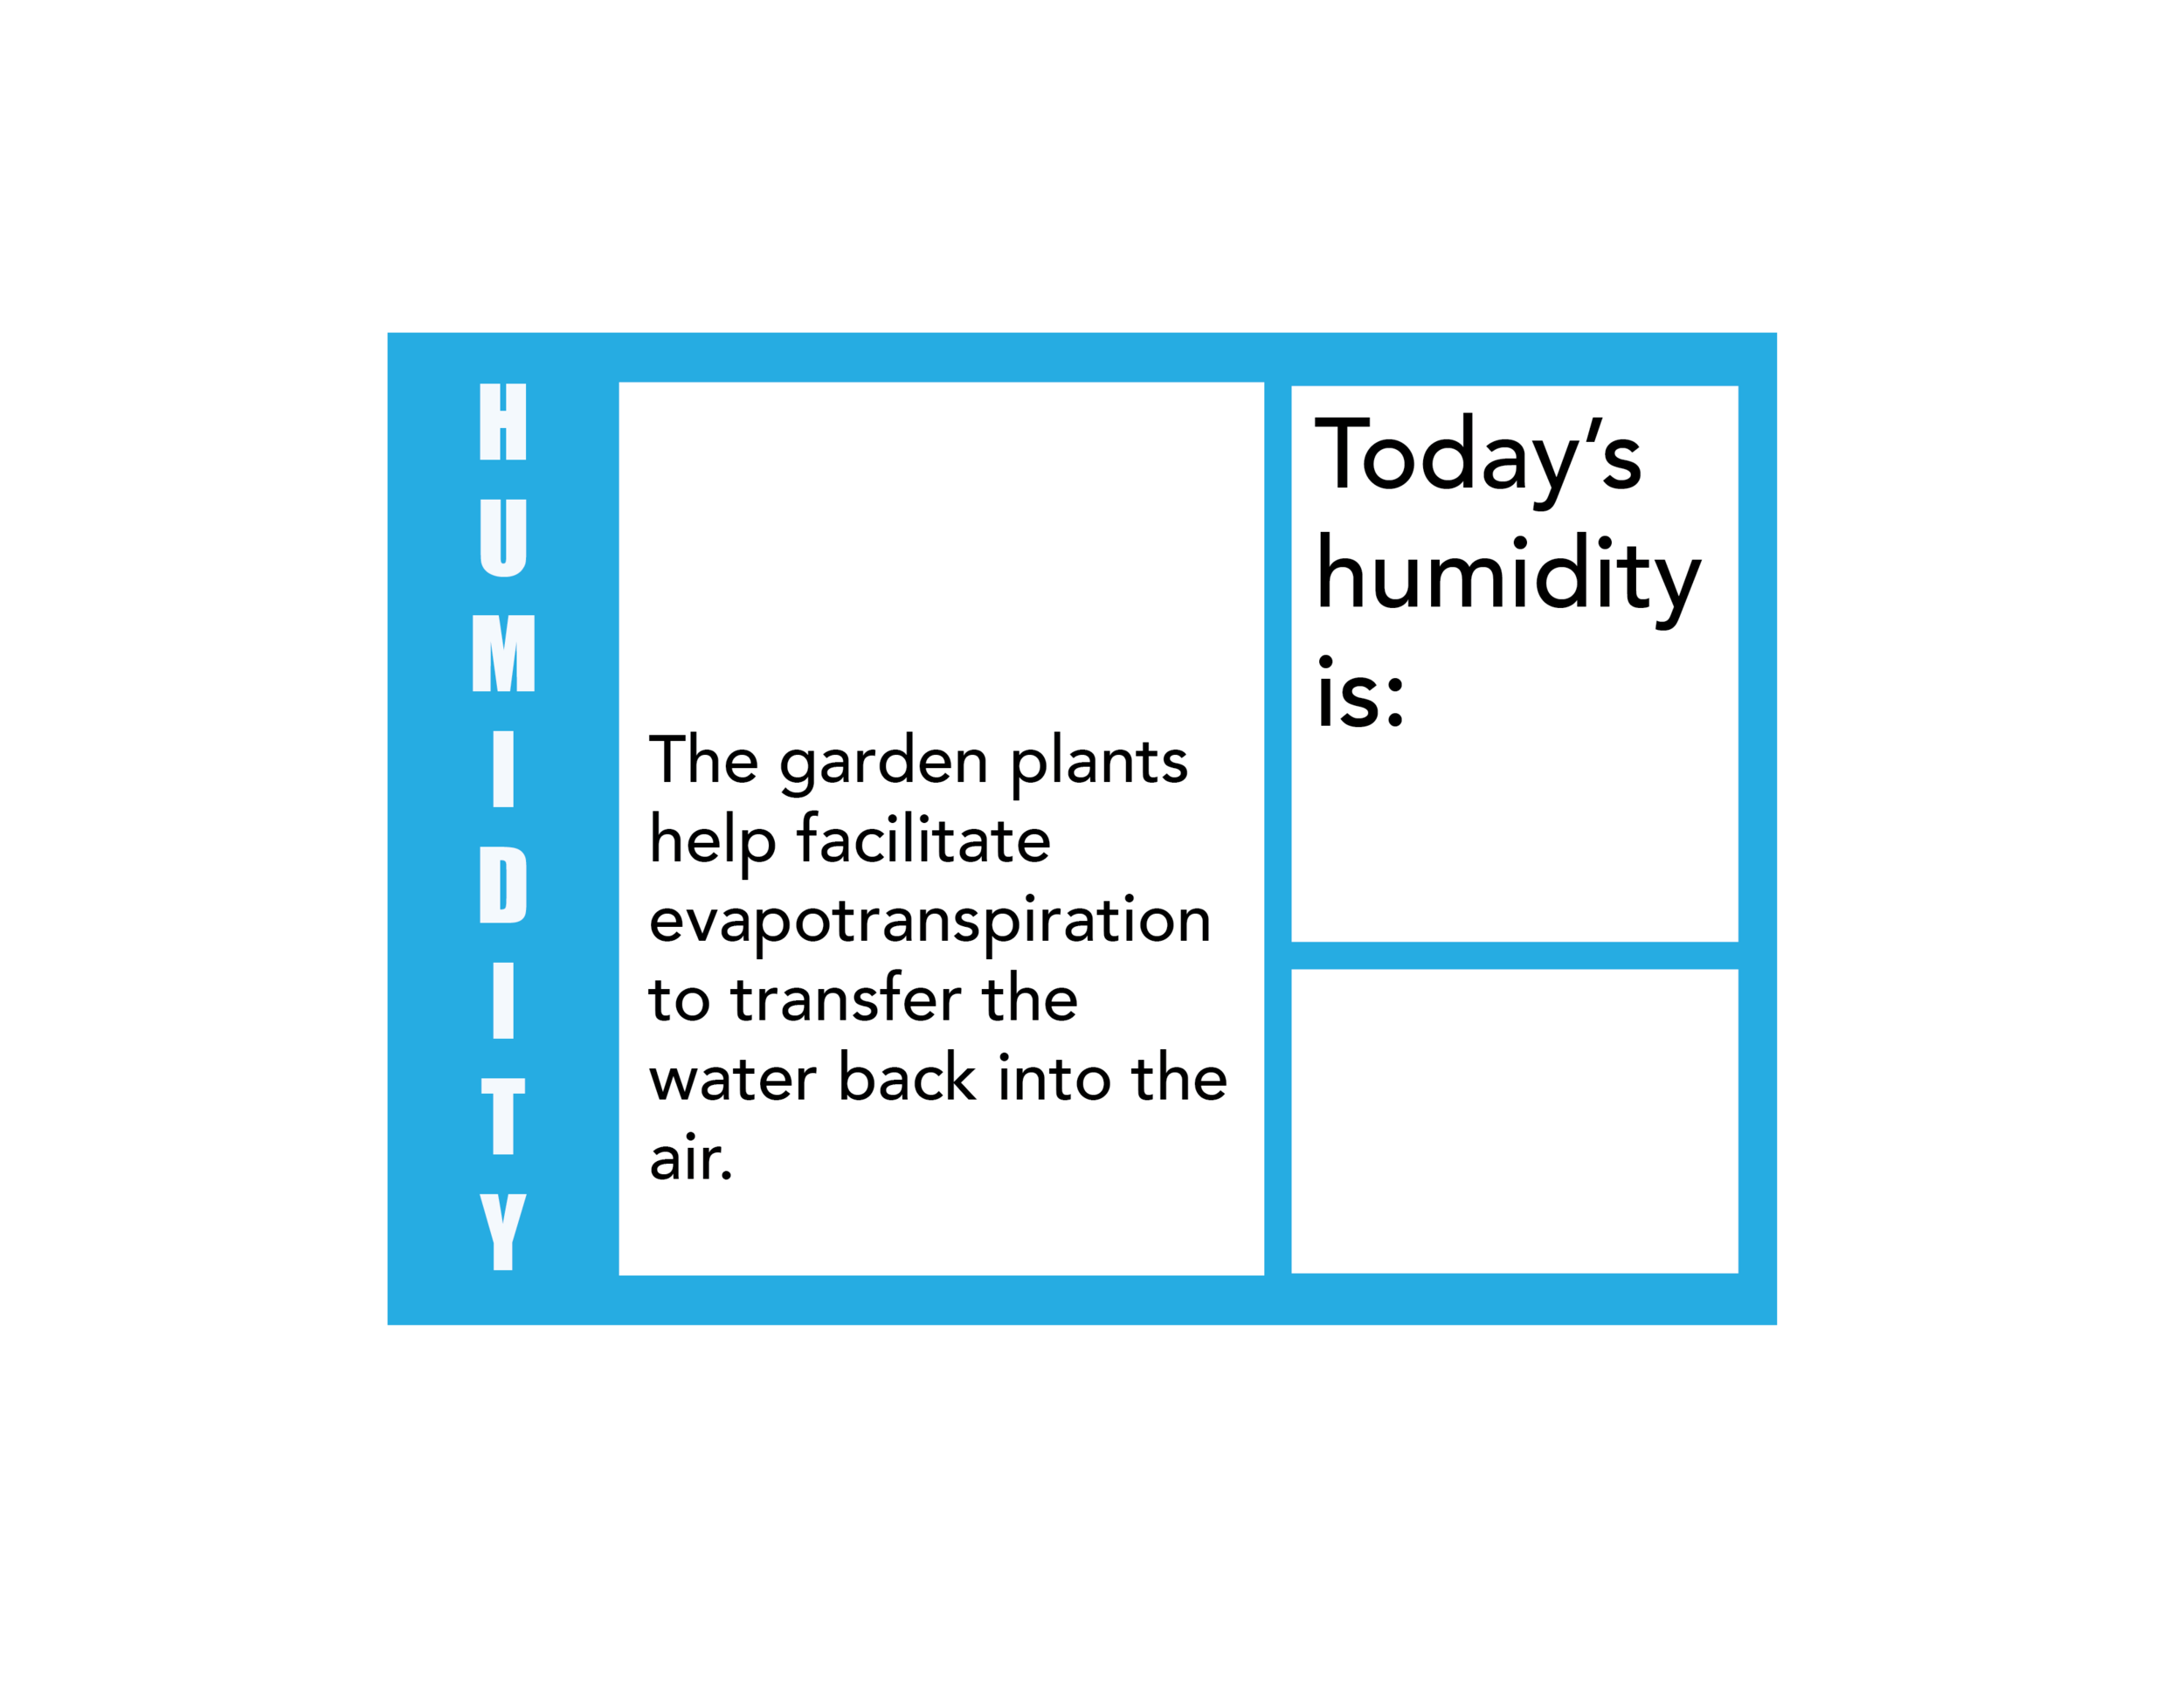
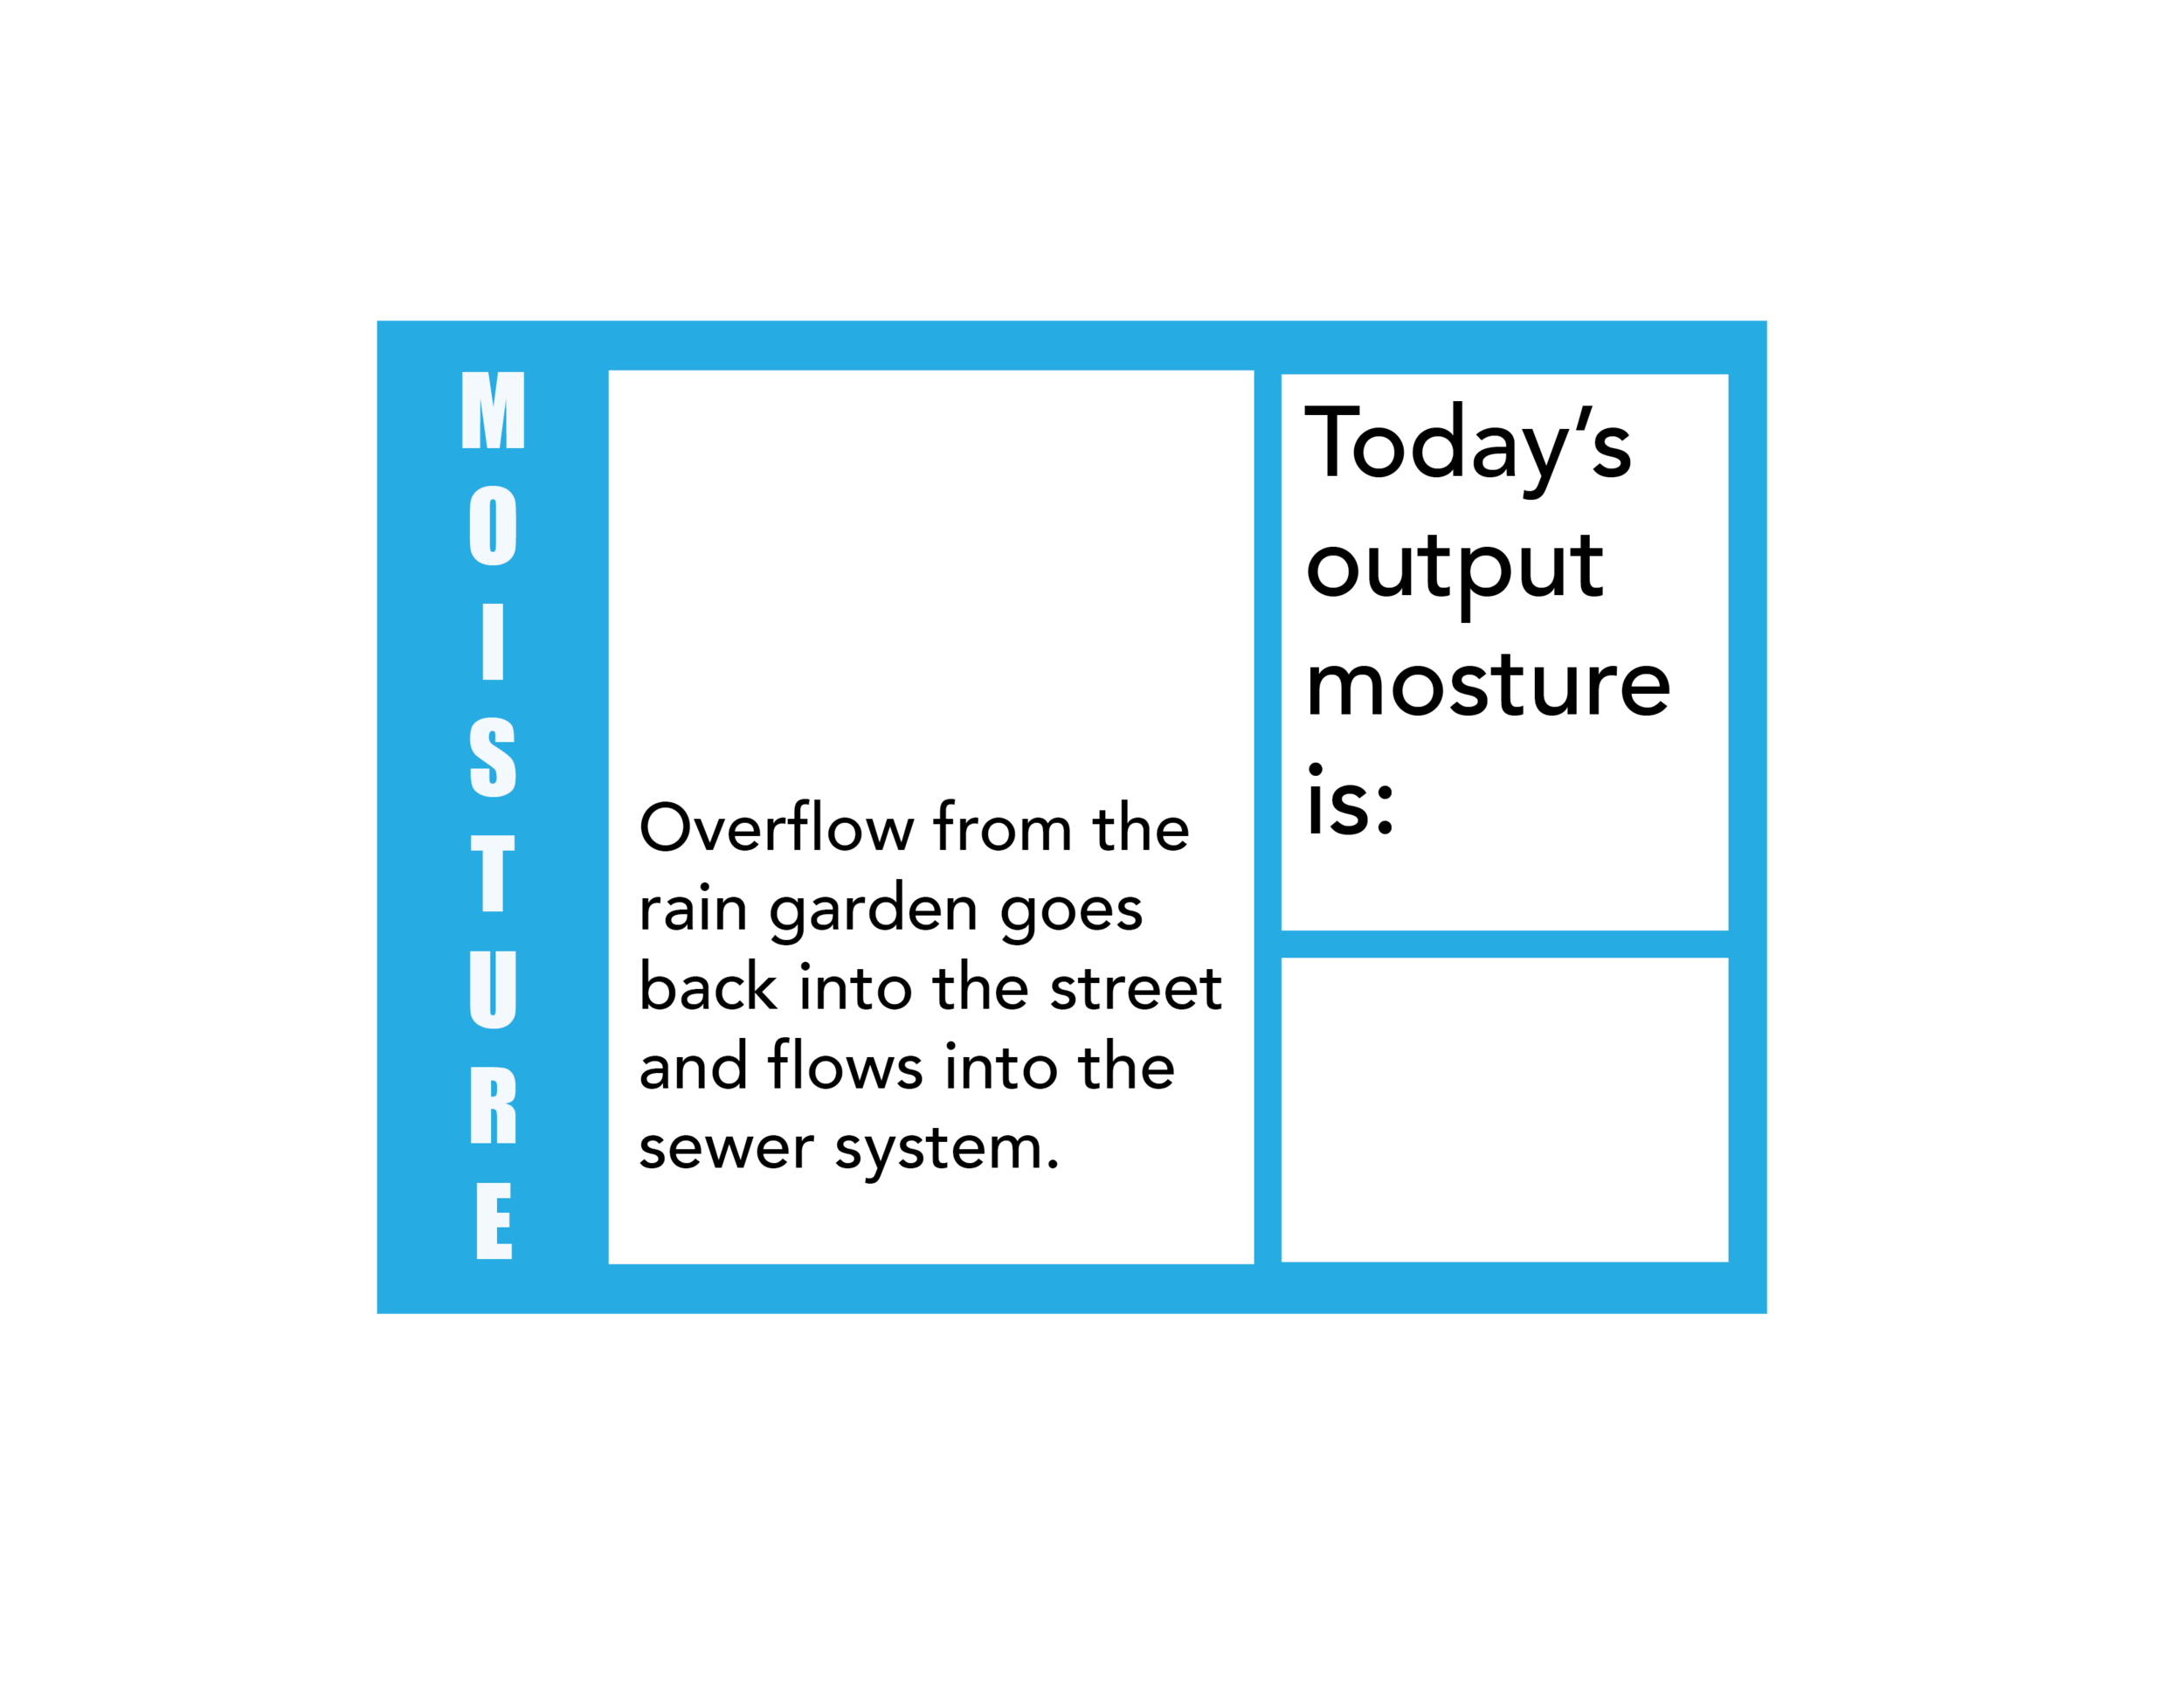
The device uses two sensors: 1) a moisture sensor and 2) a humidity and temperature sensor connected to an Arduino that takes the data and displays it on a mini LCD screen when the corresponding buttons are pressed.

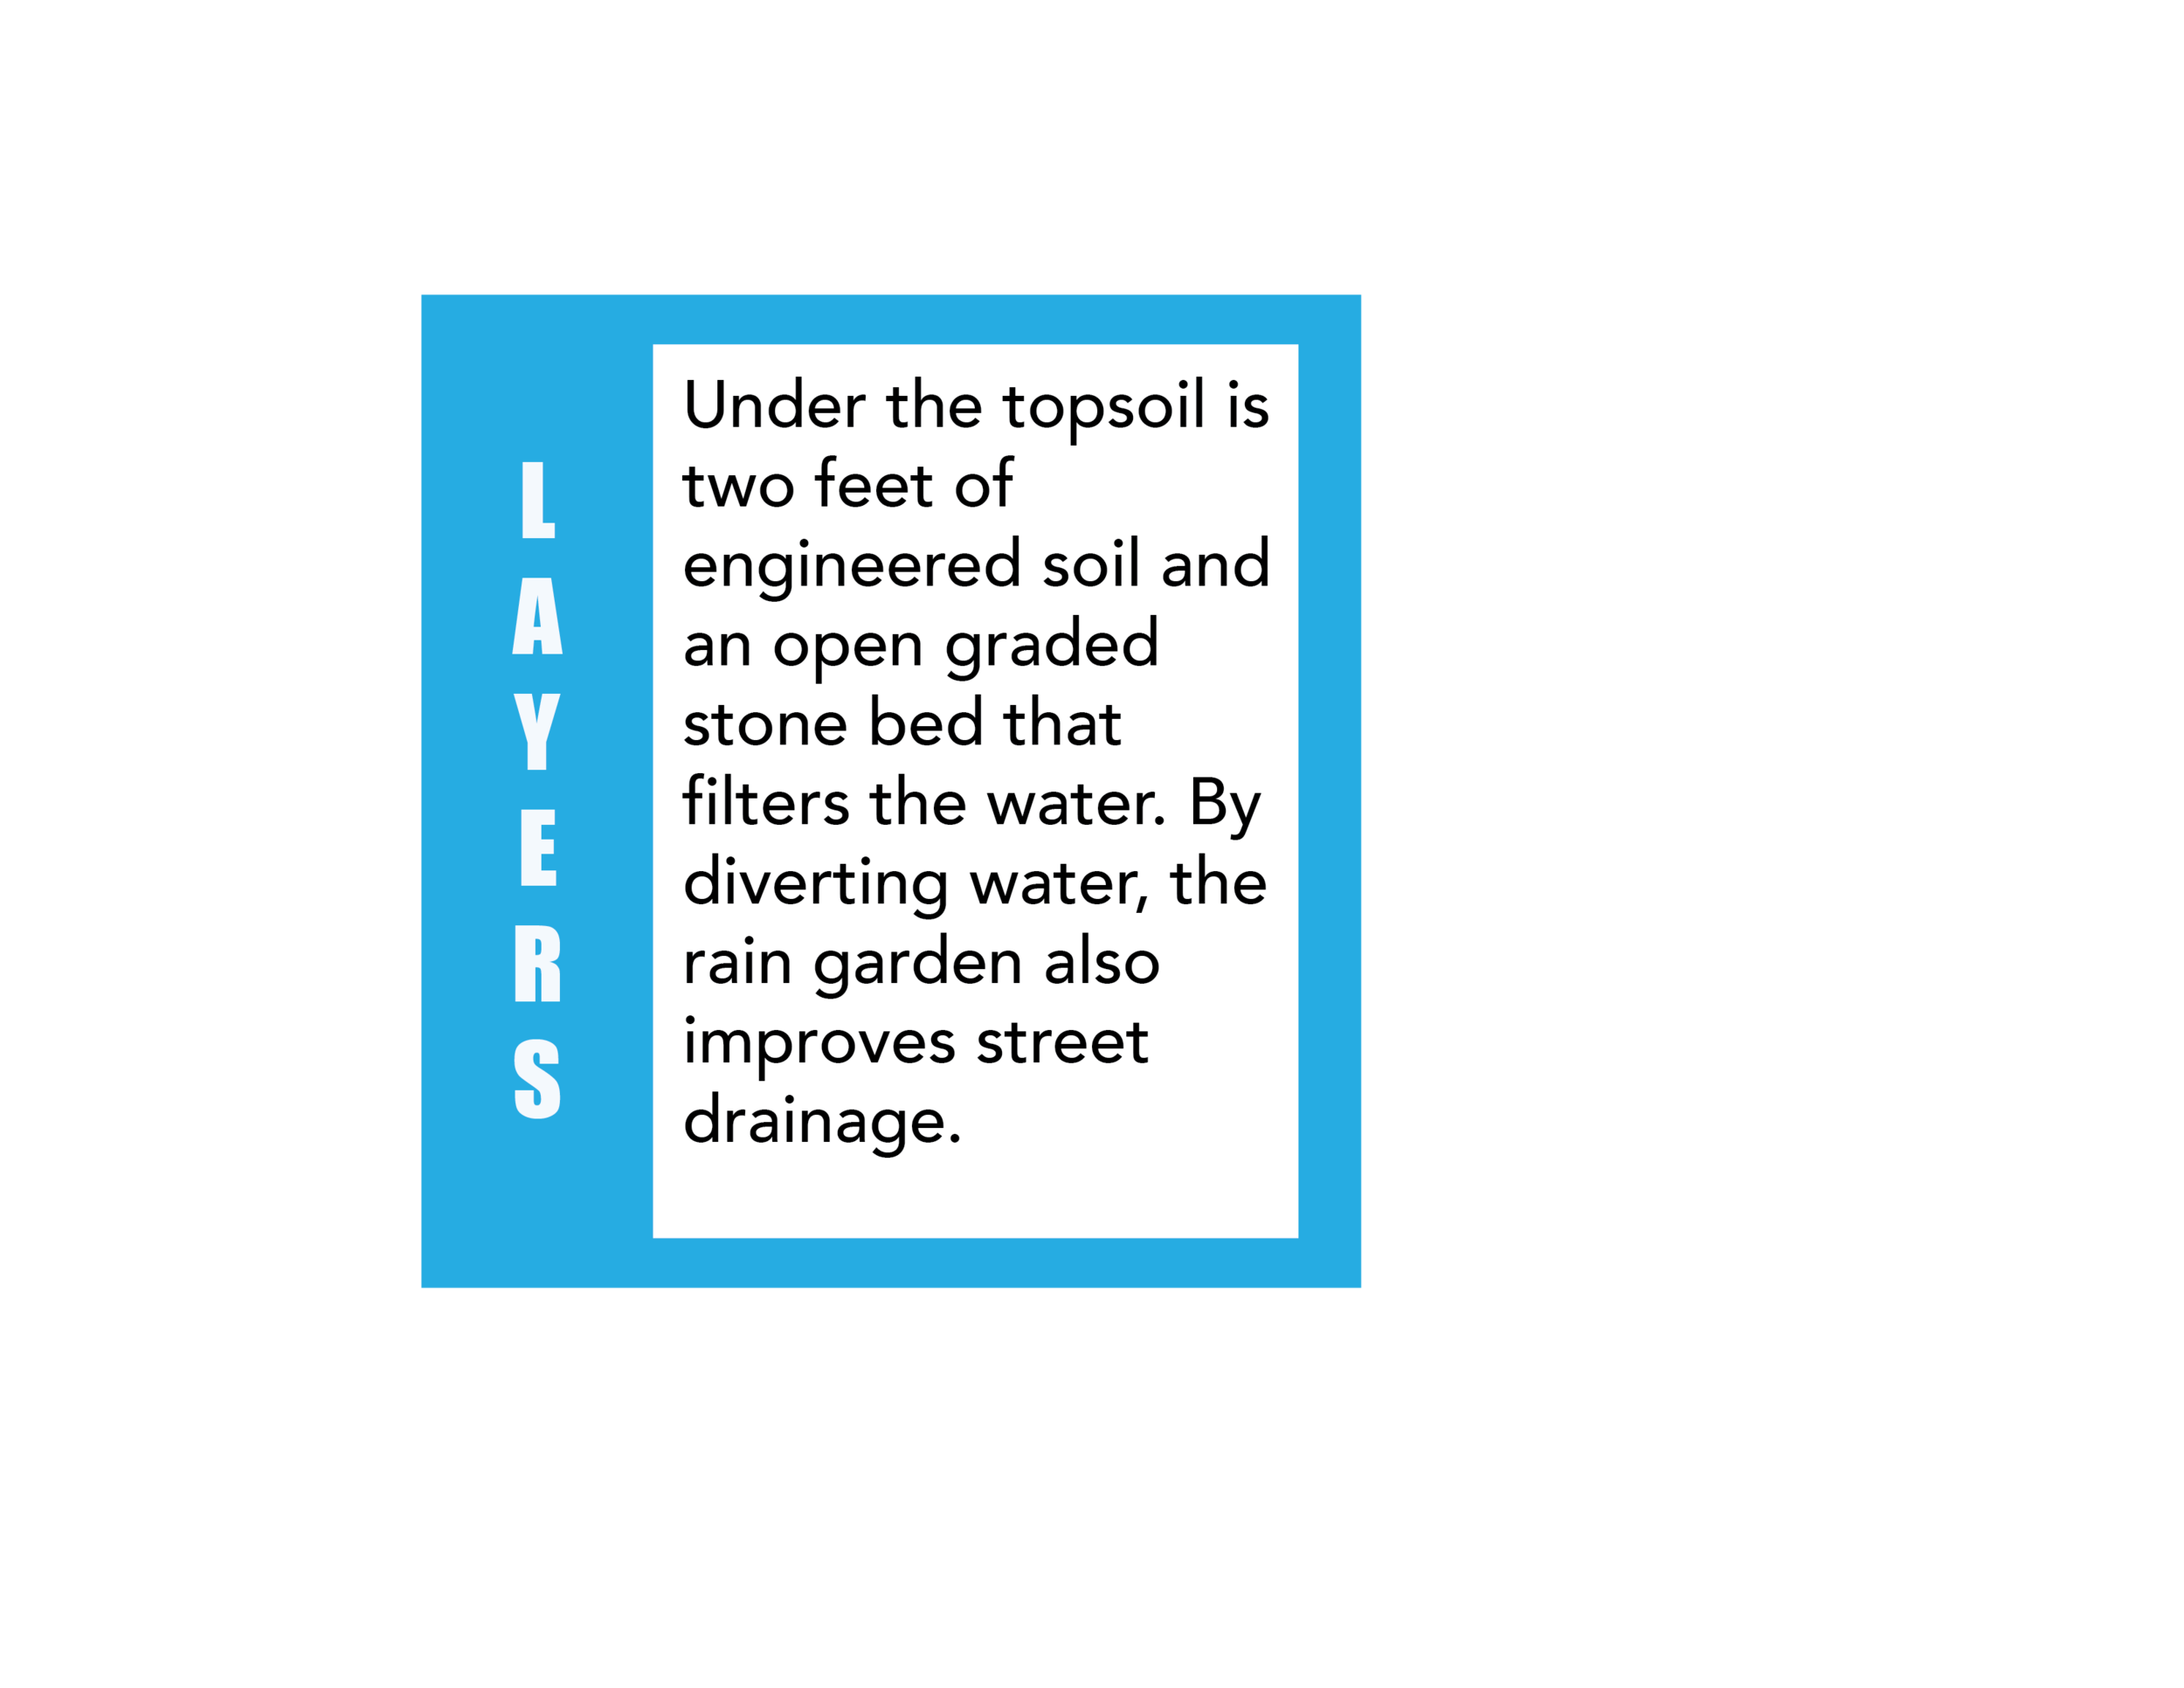
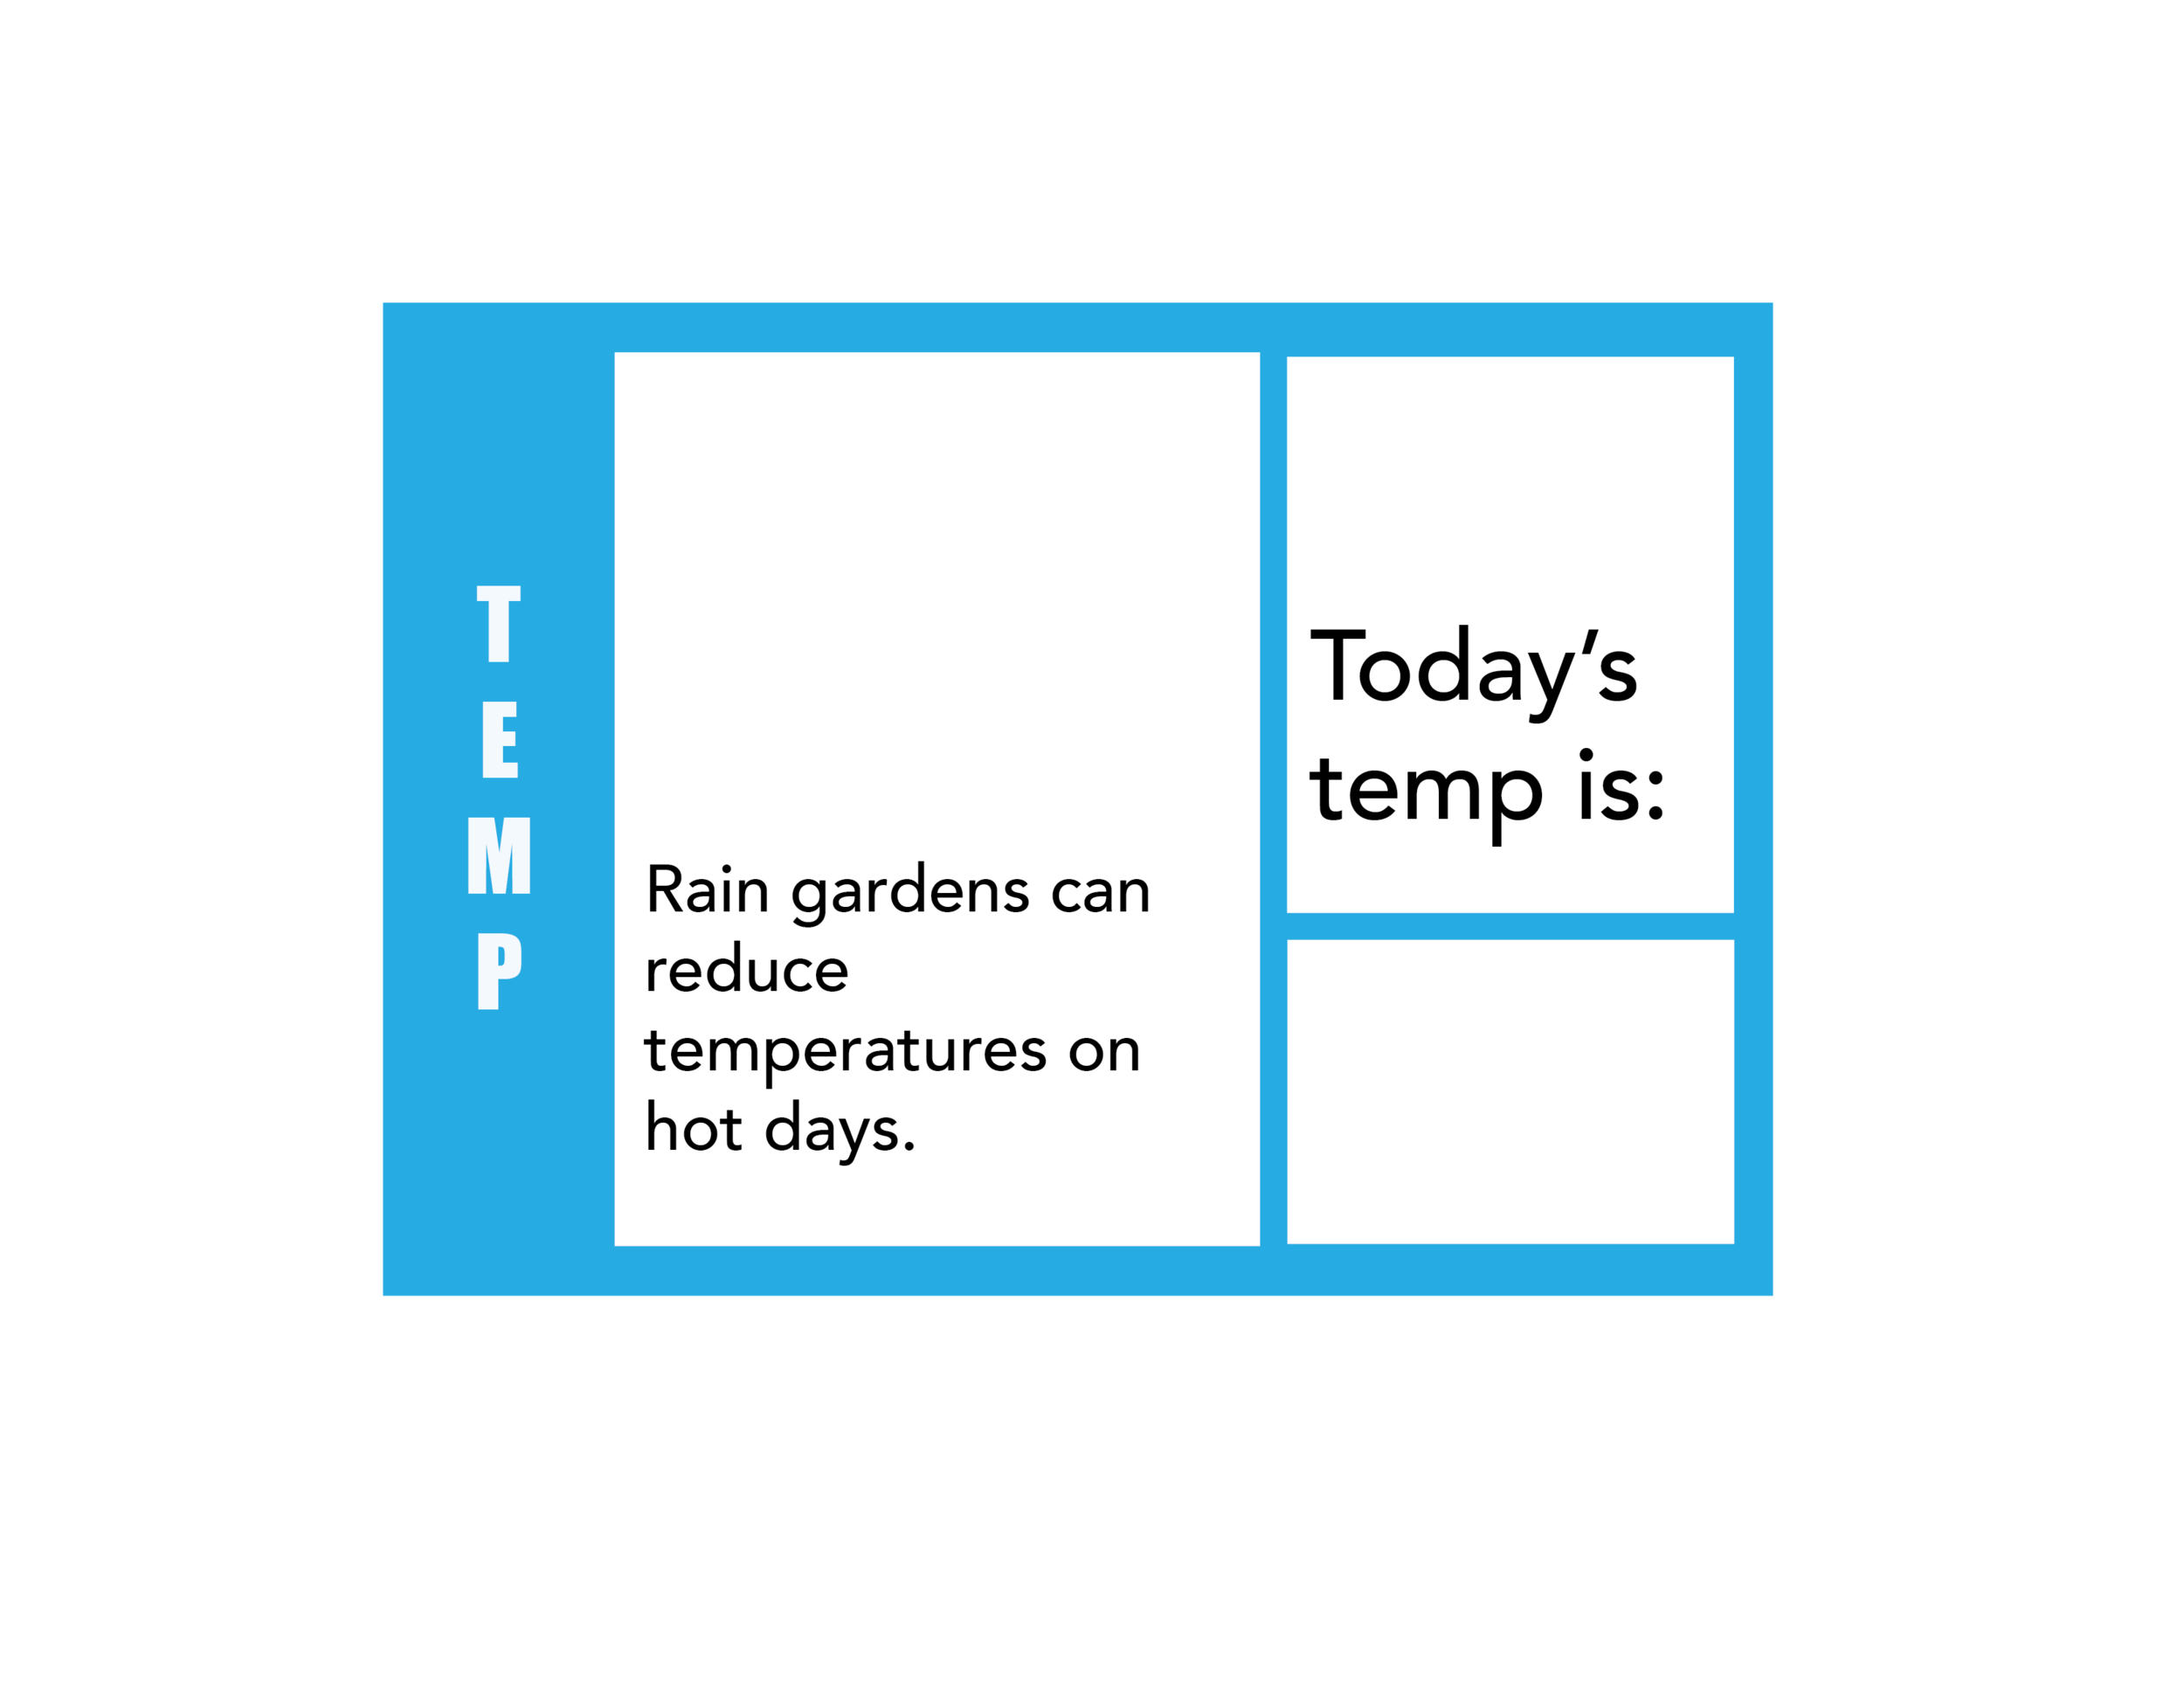
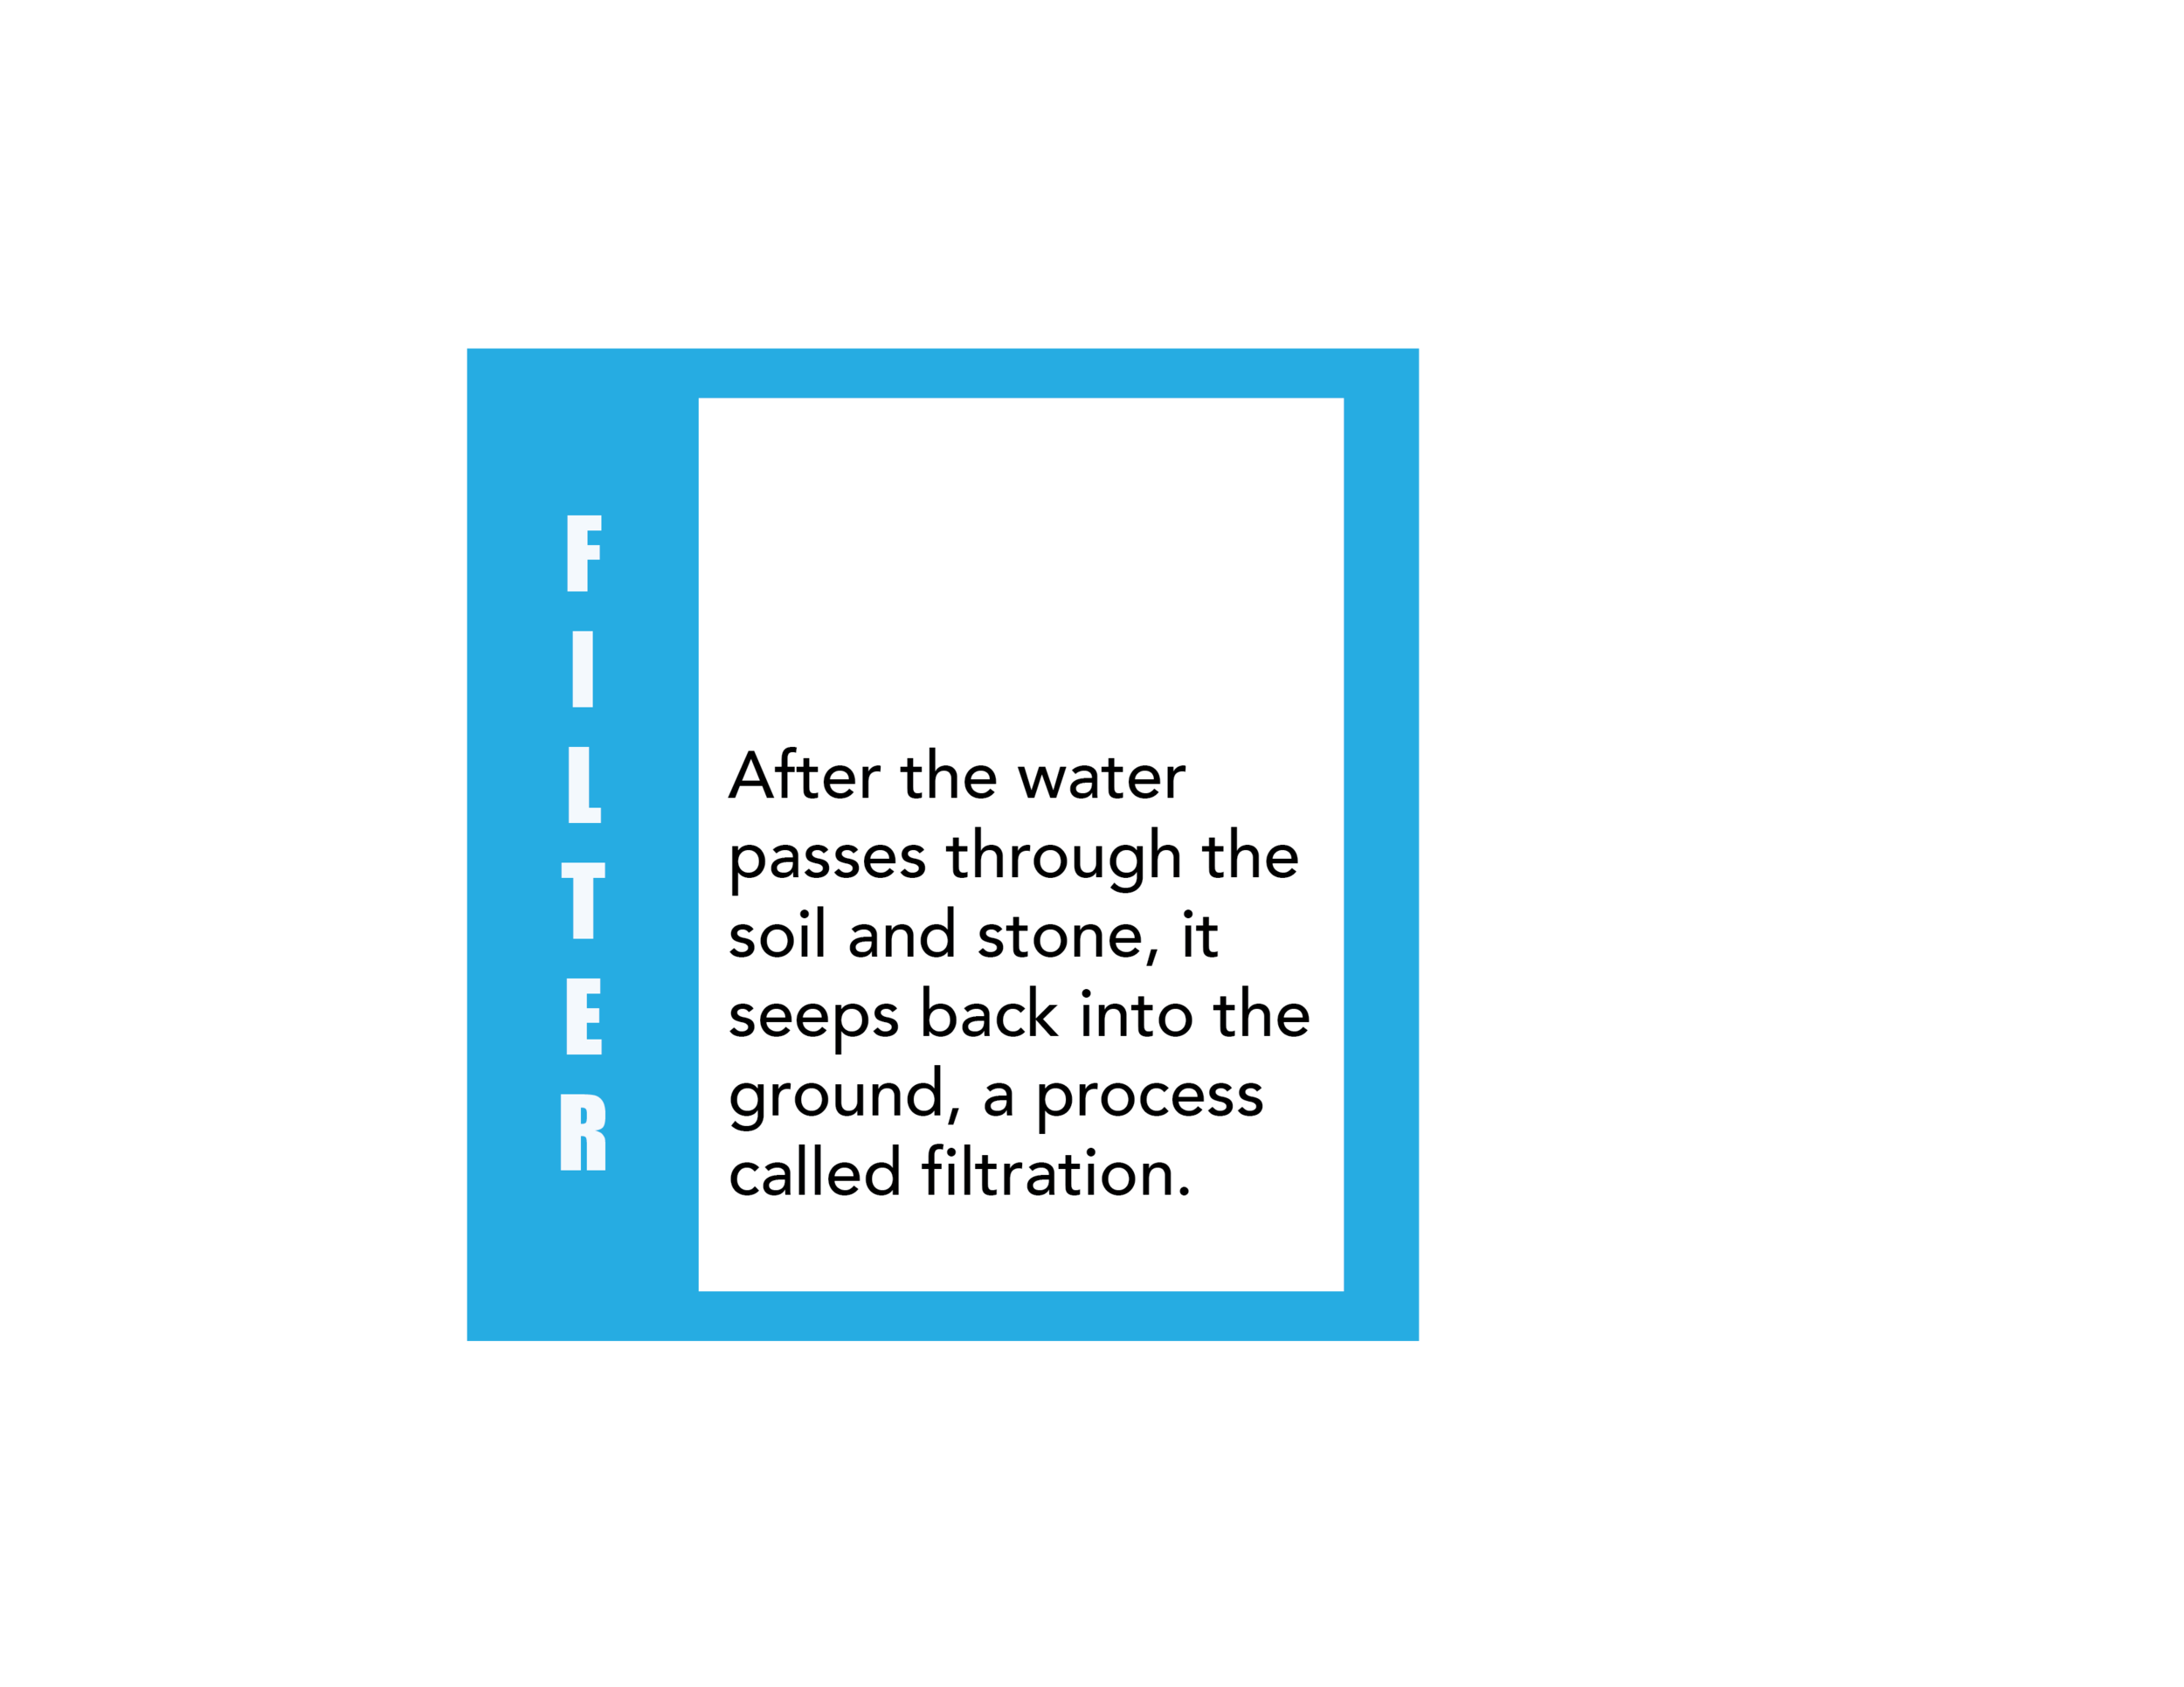
The garden steward uses this device to display the data points on the rain garden signs that explain how the rain garden works:

There are six signs in total with three different measurements:
Process
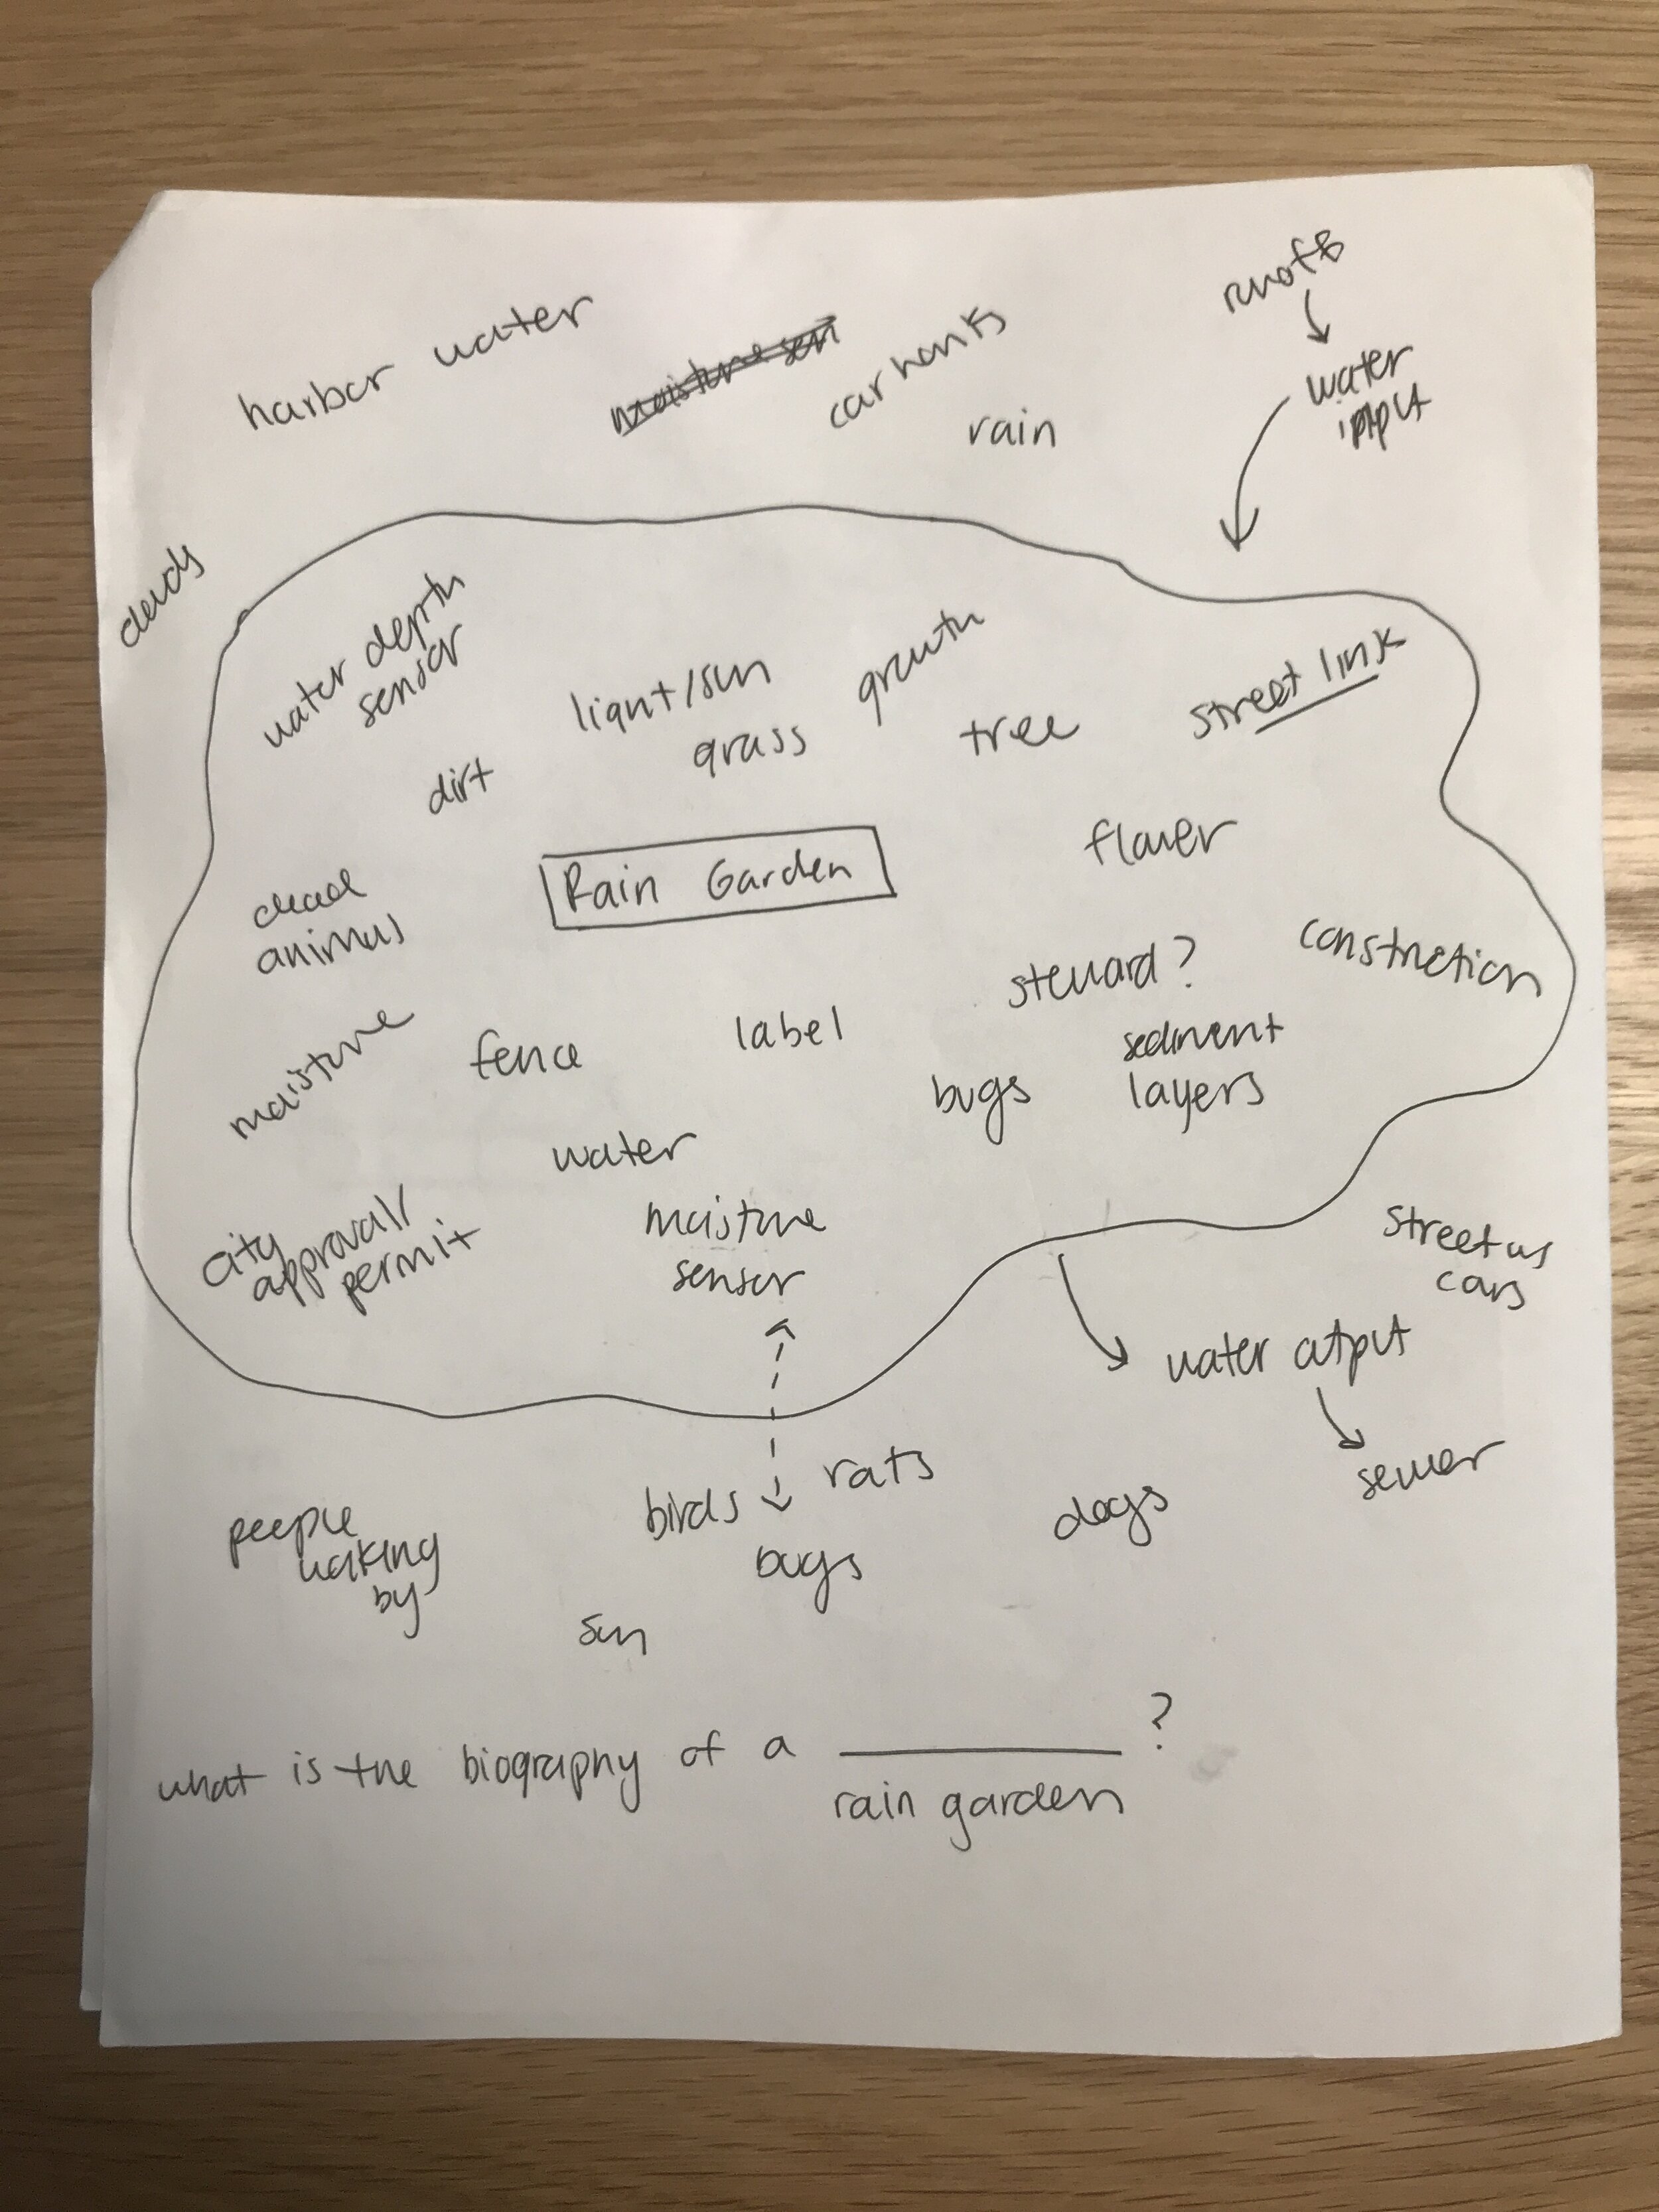
To design this collection and display of information, I started by drawing the boundary of my rain garden.
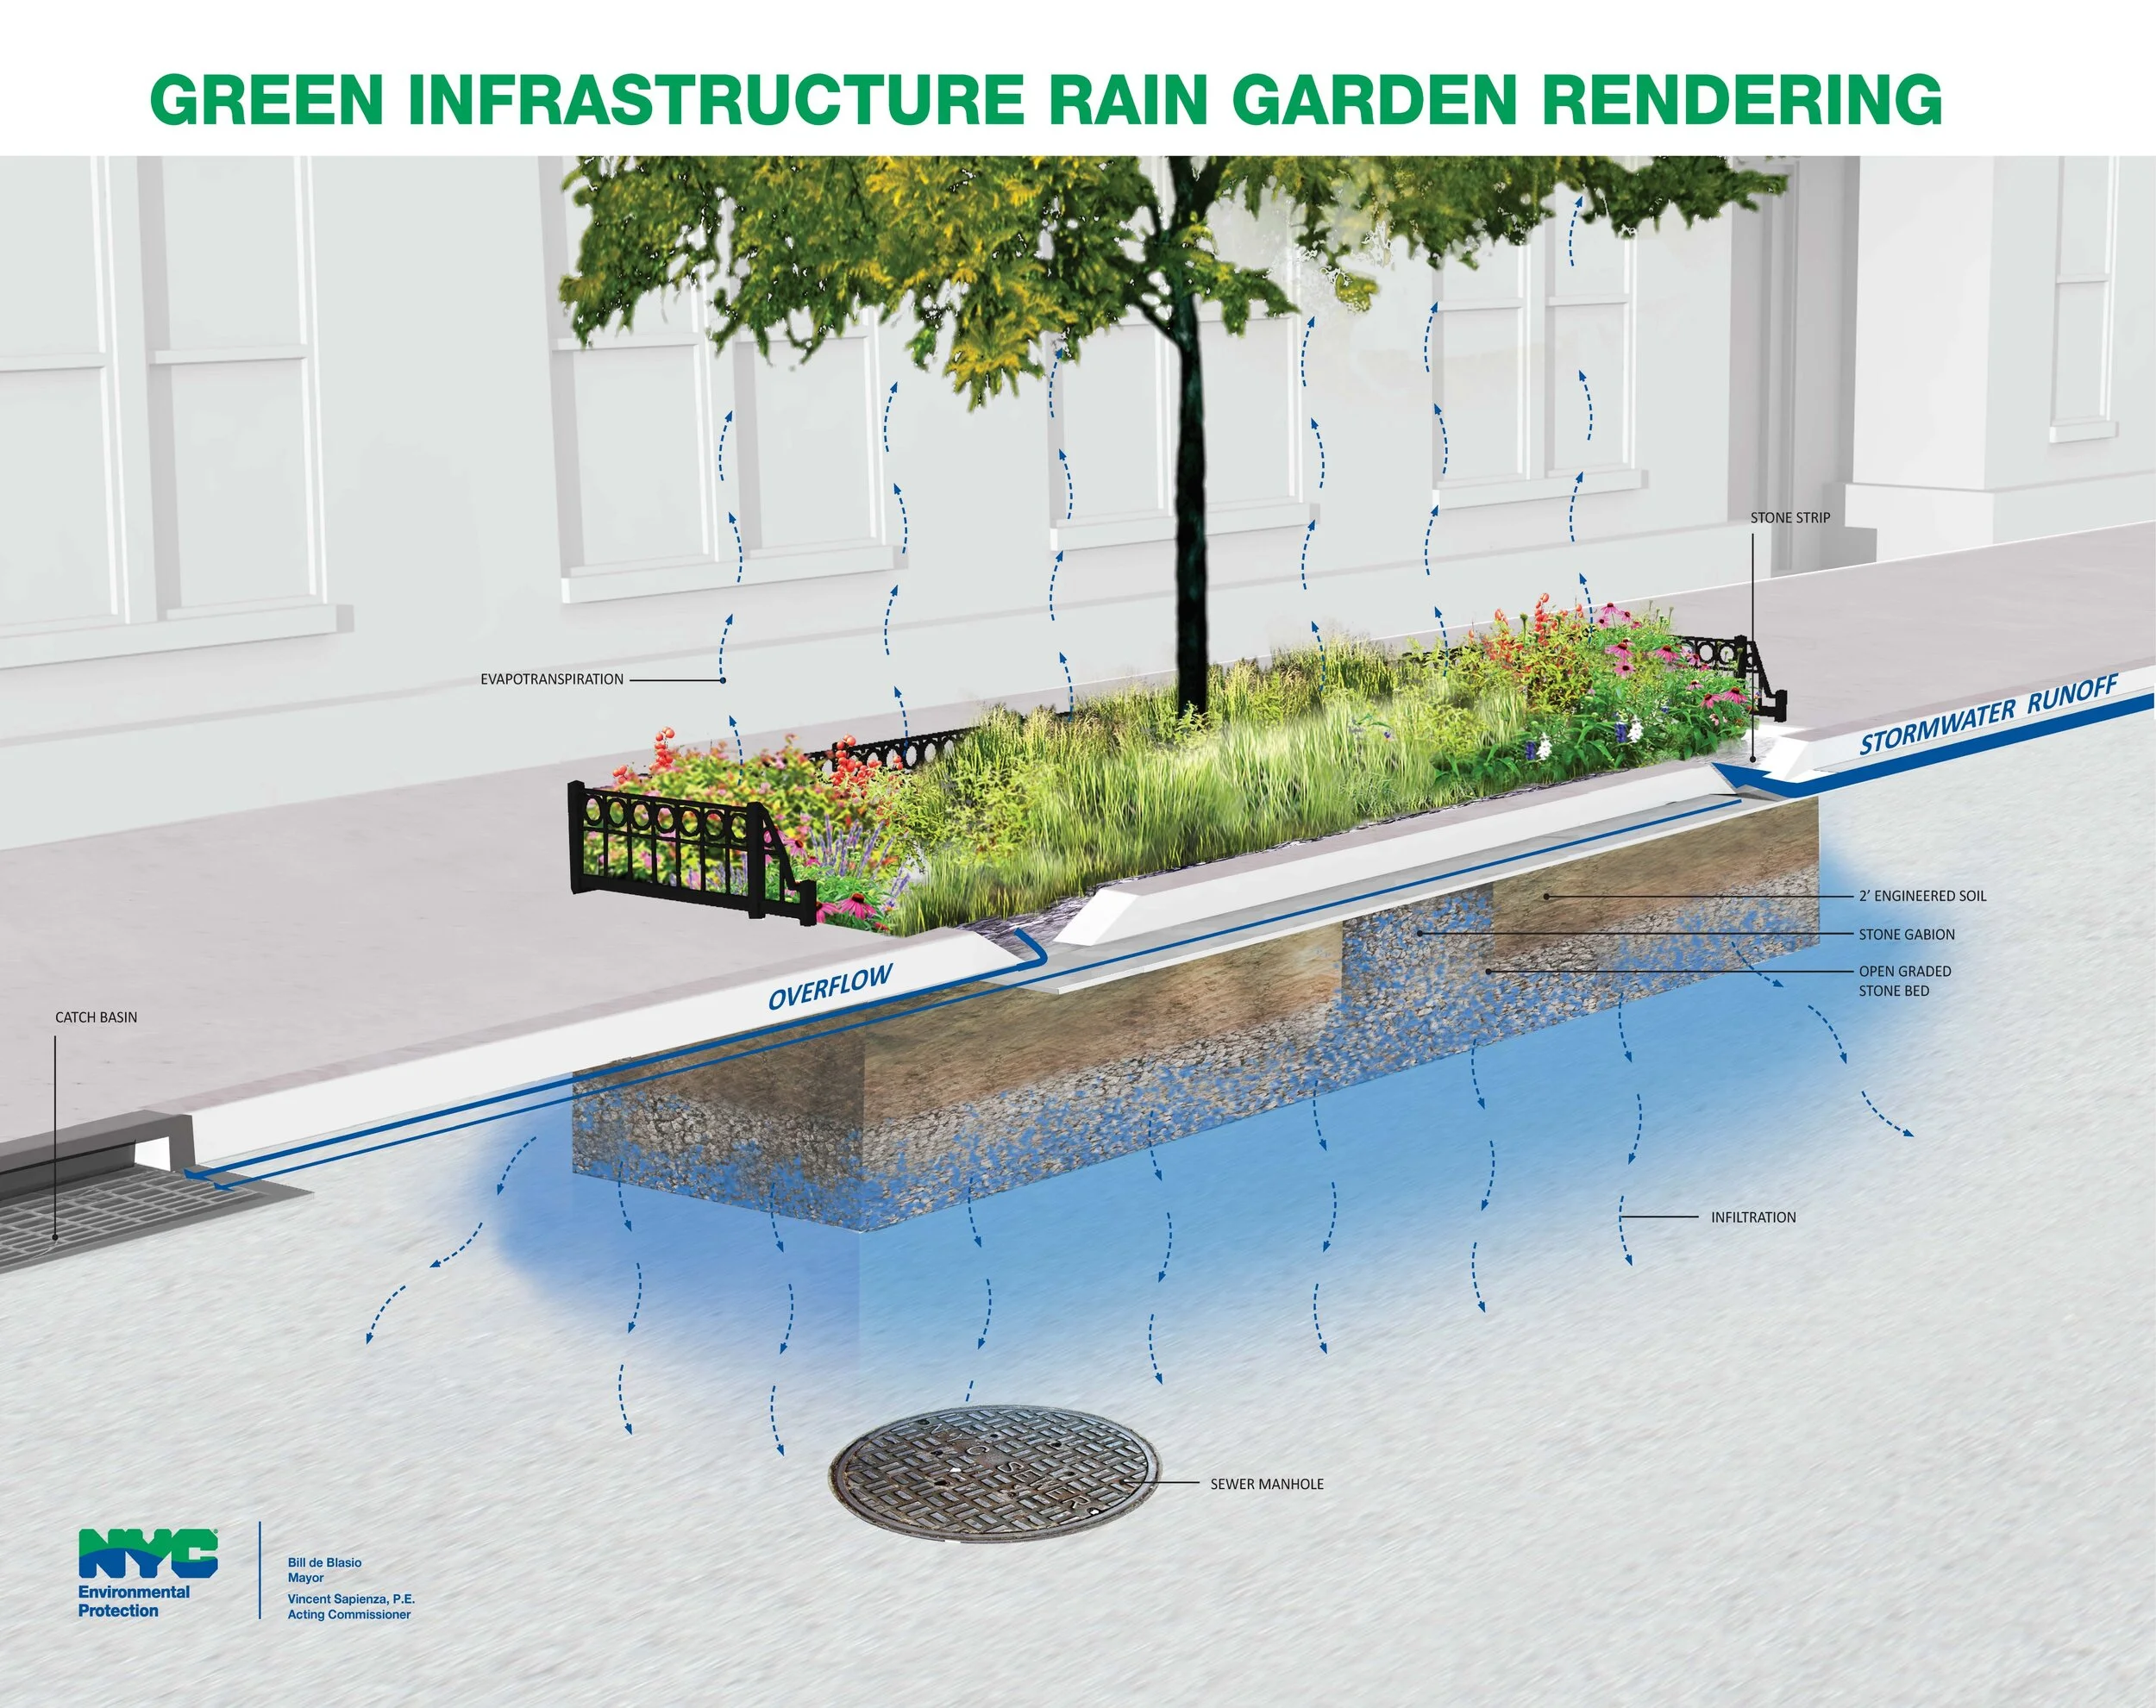
I also looked at the Rain Garden diagram made by the city and thought about the movement flows and which elements I could bring to the surface:
With the sensors I had available (in terms of time, money and availability), I decided to measure temperature, humidity and soil moisture. I also wanted to incorporate a water level sensor, but there was no rain in the forecast, so I decided to focus on what I would be able to measure.
Next, I thought about mapping these measurements to the city Rain Garden outcomes:
Next I listed out all of the part of the system I wanted to draw attention to and drew out where this information would go physically in the rain garden:

I mocked up signs in illustrator, printed and laminated them. Although these are simple printed signs, in terms of design, the goal of this intervention is to also ask: what if these data points had been integrated into the original garden design plan? How would that change the shape of the fence or how community members conceive of the rain gardens?
In terms of the data collecting device, I imagined a device that data stewards could use and I also wanted the device to be something that a citizen scientist could make. I decided to use legos for the enclosure in order to evoke a construction kit feel.

Interaction
The agency in this interaction lies with the steward. The communication of information is mediated by the garden steward who takes measurements with the device. In this interaction I was hoping that the steward would go inside the garden and get close to the dirt, literally making themselves part of the infrastructure.
I implemented this device in the morning on a weekday, so although a few people looked over and seemed to read the signs, no one stopped to inspect them more closely. The interaction I was hoping for was that people would read the signs, become award of the rain garden, learn about the system it is a part of and reconsider their own role in this system. The agency of the passerby would be how they act in relation to the rain garden receiving this information. This might change if this were a permanent installation.
Reflections and Future thoughts
If I were to do another iteration of this project, I would like to experiment with a permanently installed devices and a more creative output. I think it’s important to display the data, but would like to hide it a bit more, which would require more work from citizens to connect the dots. Perhaps I could draw on the ground with chalk or paint or install several small interactive devices. I’d also be interested in getting the rain garden “online” or into an “electronic” format either in real-time or by uploading the data after a collection period. I think additional insight could come from connecting two rain gardens or having them “communicate.” I would be interested in exposing other forms of data such as plant poses or using computer vision to understand the garden dynamic spatially.